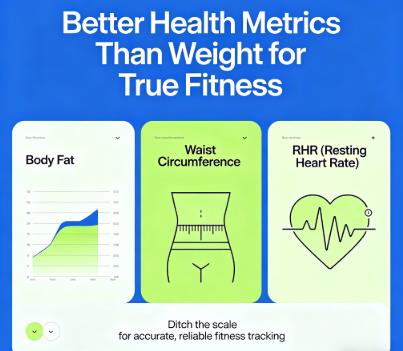
At a Glance: Health metrics better than weight for true fitness include body fat percentage, waist circumference, resting heart rate, and functional strength. Weight alone cannot distinguish between a pound of muscle and a pound of fat — it ignores body composition entirely. Body fat percentage reveals what proportion of your mass is lean tissue versus adipose. Waist circumference measures visceral fat, the metabolically active tissue around organs that drives disease risk independently of total weight. Resting heart rate reflects cardiovascular efficiency. Functional strength quantifies what your body can actually do. Track these four metrics together, and you have a far clearer picture of genuine fitness than any scale reading can provide.
Editorial review by the BMI Calculator Blog Team. Our team includes a certified exercise physiologist and a health data analyst specializing in body composition assessment and cardiorespiratory fitness measurement. Content aligned with CDC body measurement guidelines, NIH body composition research, and American Council on Exercise (ACE) body fat percentage classifications.
Why Weight Fails as a Fitness Metric: The Muscle‑Fat Blind Spot
The scale measures total body mass — nothing more. It cannot distinguish between a pound of muscle and a pound of fat. A pound is a pound. But the implications are fundamentally different. Muscle tissue is metabolically active: each pound burns approximately 6 kcal per day at rest, contributes to glucose disposal, and supports functional capacity. Adipose tissue — particularly visceral fat — secretes pro‑inflammatory cytokines that drive insulin resistance and cardiovascular strain.
This blind spot produces two common misclassifications. A strength‑training individual can gain 5 lbs of muscle and lose 5 lbs of fat, see zero change on the scale, yet have meaningfully improved body composition and metabolic health. Conversely, a sedentary person undergoing rapid weight loss via severe calorie restriction can lose 10 lbs — half of it muscle — and see a lower scale number while their body fat percentage remains elevated and their resting metabolic rate drops. The scale celebrates both outcomes equally. The body knows the difference. For a broader analysis of why the scale alone misleads, our guide on why relying only on weight is not enough for health assessment breaks down additional scenarios where weight obscures real health changes.
Metric 1: Body Fat Percentage — The Composition Standard
Body fat percentage answers the question weight cannot: what is your body made of? It is the proportion of total body mass that is adipose tissue. The remainder — lean body mass — includes muscle, bone, organs, and water.
The American Council on Exercise (ACE) publishes widely referenced body fat percentage classifications:
| Category | Men | Women |
|---|---|---|
| Essential Fat | 2–5% | 10–13% |
| Athletic | 6–13% | 14–20% |
| Fitness | 14–17% | 21–24% |
| Acceptable | 18–24% | 25–31% |
| Obese | ≥25% | ≥32% |
Two individuals can weigh 180 lbs (81.6 kg) at 5'10" (1.78 m). One carries 12% body fat — athletic, with roughly 21.6 lbs (9.8 kg) of fat. The other carries 28% body fat — obese by ACE standards — with 50.4 lbs (22.9 kg) of fat. Same weight, same height, same BMI. Completely different health profiles. A body fat calculator provides this critical distinction.
Measurement methods, from most to least accessible: bioelectrical impedance (BIA) scales (track the 7‑day trend under consistent hydration conditions), skinfold calipers using a 3‑site or 7‑site protocol, and DEXA scans for the most precise regional fat distribution data. For understanding how body fat measurement compares to BMI‑based assessment, the comparison between body fat percentage calculator vs BMI calculator explains when each metric is most useful.
Metric 2: Waist Circumference — The Visceral Fat Detector
Waist circumference measures abdominal adiposity — specifically, the visceral fat packed around the liver, pancreas, and intestines. Visceral fat is metabolically active in ways subcutaneous fat (the fat just under the skin) is not. It releases free fatty acids directly into the portal vein, promotes hepatic insulin resistance, and secretes inflammatory cytokines including IL‑6 and TNF‑α.
This is why waist circumference predicts cardiovascular disease and type 2 diabetes risk independently of BMI. Someone with a BMI of 23 and a waist circumference of 38 inches (96.5 cm) may face higher metabolic risk than someone with a BMI of 27 and a waist circumference of 32 inches (81.3 cm).
CDC elevated‑risk cutoffs: Men ≥40 inches (102 cm); non‑pregnant women ≥35 inches (88 cm).
Measurement protocol: Use a flexible tape measure. Locate the top of the iliac crest (hip bone). Wrap the tape around the abdomen at this level, parallel to the floor. Take the measurement at the end of a normal exhale — don't suck in or push out.
Frequency: Monthly. A 1–2 inch (2.5–5 cm) reduction in waist circumference over 3–6 months signals meaningful visceral fat loss, even if total weight barely moves.
Metric 3: Resting Heart Rate — The Cardiovascular Efficiency Score
Resting heart rate (RHR) measures how many times the heart beats per minute at complete rest — typically first thing in the morning, before rising. A lower RHR indicates a stronger, more efficient heart muscle that pumps more blood per beat (higher stroke volume), requiring fewer beats per minute to perfuse the body.
General adult range: 60–100 bpm per the American Heart Association.
Fit individual range: 40–60 bpm. Endurance athletes often record RHR in the high 30s to low 50s.
Tracking protocol: Measure before getting out of bed. Use two fingers on the radial artery (wrist) or carotid artery (neck). Count beats for 30 seconds; multiply by 2. Alternatively, most wearable fitness trackers and smartwatches provide overnight RHR averages automatically.
Trend interpretation: A declining RHR over weeks and months — for example, from 78 bpm to 68 bpm — indicates improving cardiovascular fitness. An elevated RHR compared to personal baseline can signal overtraining, dehydration, stress, or insufficient recovery.
Metric 4: Functional Strength — What Your Body Can Do
Body composition and cardiovascular metrics describe what you are made of and how efficiently your systems operate. Functional strength measures what your body can actually perform. This metric is inherently practical: can you carry groceries up a flight of stairs, rise from the floor without assistance, or hold a plank without collapsing? These capacities correlate more directly with quality of life and independence across the lifespan than any scale reading.
Push‑ups (upper body endurance): Track maximum consecutive reps with proper form. A 35‑year‑old man performing 20 consecutive push‑ups and progressing to 30 over three months has measurably improved upper‑body endurance — regardless of weight change.
Plank hold (core stability): Time how long you can maintain a forearm plank with hips level, core engaged, and no sagging or piking. Progressing from 30 seconds to 60 seconds reflects genuine core strengthening.
Body‑weight squat (lower body function): Count consecutive reps to parallel with proper form. This movement replicates sitting and rising from a chair — a daily functional task that predicts mobility independence in older adults.
Walking speed (gait speed): Time a one‑mile walk or a 400‑meter walk. Gait speed is a powerful predictor of functional independence and all‑cause mortality in adults over 65, per NIH longitudinal studies. A 6% improvement in walking speed over 3–6 months is a meaningful functional gain.
How the Four Metrics Compare to Weight
| Metric | What It Measures | What Weight Misses | Tracking Frequency |
|---|---|---|---|
| Body Fat % | Proportion of adipose vs. lean tissue | Cannot distinguish 180 lbs of muscle from 180 lbs of fat | Monthly |
| Waist Circumference | Visceral abdominal fat | Ignores fat distribution — the key predictor of metabolic risk | Monthly |
| Resting Heart Rate | Cardiovascular efficiency | Provides no information on heart function or fitness | Weekly |
| Functional Strength | Physical capacity and performance | Tells you nothing about what your body can do | Monthly |
| Weight (reference) | Total body mass | — | Weekly (as one data point among several) |
The relationship between BMI and body fat percentage further illustrates why composition matters more than total mass. A BMI of 26 with 12% body fat is a muscular, metabolically healthy individual. A BMI of 26 with 30% body fat is a different clinical picture. The scale and the BMI calculator see the same number. Body fat percentage sees the difference.
A Monthly Tracking Protocol
Week 1, Monday morning: Weigh yourself (post‑void, pre‑food). Measure waist circumference. Record both.
Week 2, Monday morning: Check resting heart rate before rising. Record.
Week 3: Perform a functional strength test — push‑ups to failure, plank hold time, or a timed one‑mile walk. Record the result.
Week 4: Estimate body fat percentage using a BIA scale or calipers under consistent conditions. Record. Review the month's trend across all four metrics. A brief check with a BMI Calculator adds the weight‑for‑height baseline to complete the five‑metric picture.
The goal is not perfection on any single number. It's convergence. When body fat percentage trends downward, waist circumference shrinks, resting heart rate declines, and functional strength increases — genuine fitness improvement is occurring. The scale might reflect it. It might not. The four metrics above will.
Content Integrity Review: All body fat percentage classifications align with American Council on Exercise (ACE) guidelines. Waist circumference cutoffs follow CDC body measurement standards. Resting heart rate ranges align with American Heart Association and NIH data. Functional strength assessment protocols are consistent with ACSM fitness testing guidelines.
Prepared using ACE body fat percentage tables, CDC anthropometric measurement standards, NIH body composition and cardiovascular fitness research, and ACSM health‑related physical fitness assessment protocols.
Sources
American Council on Exercise: Body Fat Percentage Guidelines
NIH NHLBI: Assessing Weight and Health Risk — Waist Circumference Guidelines
American Heart Association: Target Heart Rates and Resting Heart Rate
Frequently Asked Questions
Why is body fat percentage a better health metric than weight?
Body fat percentage distinguishes between lean mass (muscle, bone, organs) and adipose tissue. Weight alone treats all mass equally. Two individuals at 180 lbs (81.6 kg) can have body fat percentages of 12% and 30% — one is athletic, the other is clinically obese by ACE standards. Body fat percentage reveals which scenario applies. Weight does not.
What waist circumference indicates elevated health risk?
The CDC defines elevated risk at ≥40 inches (102 cm) for men and ≥35 inches (88 cm) for non‑pregnant women, measured at the top of the iliac crest after a normal exhale. Waist circumference above these cutoffs correlates with increased visceral fat — the metabolically active tissue around organs that drives inflammation, insulin resistance, and cardiovascular disease independently of total body weight.
What is a good resting heart rate for a fit individual?
For generally fit adults, a resting heart rate between 40 and 60 bpm indicates strong cardiovascular efficiency. Endurance athletes may record RHR in the high 30s to low 50s. A declining RHR over weeks and months signals improving heart efficiency — the heart pumps more blood per beat and works less to perfuse the body at rest. Measure first thing in the morning before rising for the most consistent readings.
How do I track fitness progress without using a scale?
Track body fat percentage monthly (BIA scale or calipers under consistent conditions), waist circumference monthly (tape measure at the iliac crest), resting heart rate weekly (morning pulse check), and functional strength monthly (push‑up max, plank hold time, or timed walk). When body fat drops, waist shrinks, RHR declines, and strength improves — fitness is improving. The scale may or may not confirm it, and that's the point.
Should I stop weighing myself entirely?
Not necessarily. Weight is one data point among several. Weighing yourself weekly under consistent conditions — same scale, same time, same clothing — provides a trend line. But weight should be interpreted alongside body fat percentage, waist circumference, resting heart rate, and functional strength. If the scale stalls but waist circumference shrinks and strength increases, body composition is improving. The scale alone would miss it.
BMI Calculator Blog. This content is provided for educational and informational purposes only. We encourage sharing with proper attribution to our site. Unauthorized commercial use is prohibited. Medical Disclaimer: The content of this article is for informational purposes only and does not replace professional medical advice, diagnosis, or treatment. Always seek the advice of a qualified physician or other licensed health provider with any questions regarding your fitness tracking, body composition, or cardiovascular health.