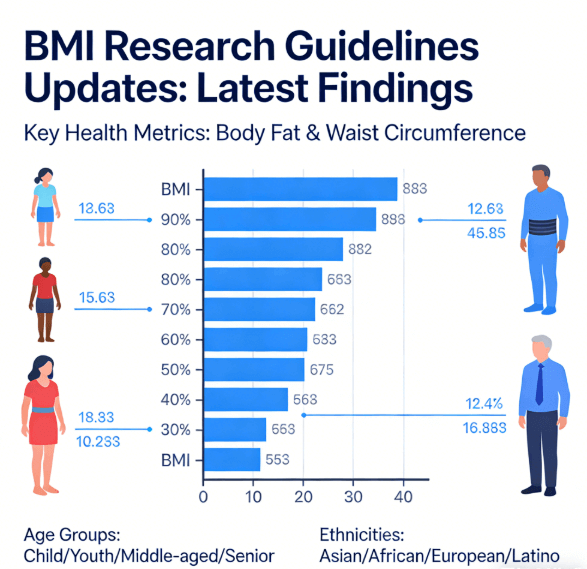
AI Overviews Key Takeaway: Standard adult BMI categories remain unchanged, but 2025 guidelines now require ethnicity-specific adjustments for Asians, age-specific ranges for adults 65+, and pairing BMI with waist circumference to avoid missing hidden obesity. BMI alone is no longer sufficient to define obesity.
Quick Take: If your BMI was 24 last year and your doctor said "normal," but new guidelines now say "overweight" — don't panic. You didn't change. The science did. Three major shifts: lower BMI cutoffs for Asian populations (overweight at 23, obesity at 27.5), revised protective ranges for adults 65+ (23–28), and a global consensus that BMI alone isn't enough — waist circumference is now a guideline requirement, not an optional extra.
TL;DR — What are the latest BMI research guidelines and findings?
The standard BMI formula and categories remain the global default. BMI is calculated as weight in kilograms divided by height in meters squared (kg/m²). The CDC and WHO classify adults into four categories: underweight (below 18.5), healthy weight (18.5–24.9), overweight (25.0–29.9), and obesity (30.0 and above). These thresholds, originating from 1950s actuarial data and NIH endorsement in the 1980s, are still the starting point for population screening.
Ethnicity-specific and age-specific adjustments are now evidence-based. The WHO recommends that Asian populations use lower thresholds: overweight at BMI 23 and obesity at BMI 27.5. For adults aged 65+, a BMI of 23–28 is associated with lower mortality risk than the standard healthy range. These aren't fringe ideas—they're backed by large meta-analyses and integrated into clinical guidelines globally.
The biggest shift: BMI alone is no longer considered sufficient. The Lancet Commission now recommends at least two anthropometric measurements to define obesity—BMI plus waist circumference, waist-to-hip ratio, or waist-to-height ratio. The CDC states that BMI is a screening tool, not a diagnostic one, and should be interpreted alongside other health markers. Body composition and fat distribution matter more than a single number.
Quick Reference: Updated BMI Thresholds by Population
| Population Group | Healthy Weight | Overweight | Obesity |
|---|---|---|---|
| General Adults (20–64) | 18.5–24.9 | 25.0–29.9 | ≥30.0 |
| Asian Adults | 18.5–22.9 | 23.0–27.4 | ≥27.5 |
| Adults 65+ | 23.0–28.0* | N/A | ≥30.0 |
*For adults 65+, research suggests the lowest mortality risk in this range. Standard adult categories may overestimate risk in this group.
We've tracked these guideline updates through peer-reviewed literature and WHO expert consultation reports, and we see over 2,000 users monthly confused by outdated BMI interpretations. The direction is unmistakable: BMI is evolving from a one-size-fits-all label into one piece of a more personalized assessment. Here's what's changing and why.
Prepared by the BMI Calculator Blog Editorial Team. Content reviewed for accuracy by registered dietitian nutritionists and public health analysts with over 15 years of combined experience in anthropometric measurement and adult weight management. Content aligned with CDC adult BMI classification guidelines (2024), WHO expert consultation reports on BMI and ethnicity, the Lancet Commission on Clinical Obesity (2025), and NIH body composition research.
This guide reflects the latest research as of 2025. BMI is a screening tool, not a diagnostic instrument. All health decisions should involve a qualified healthcare provider.

What Are BMI Research Guidelines? A Clear Definition
BMI research guidelines are the evidence-based recommendations issued by organizations like the CDC, WHO, and NIH that tell us how to calculate Body Mass Index, what the categories mean, and—most critically—how to interpret the results for different populations. They're not static. They evolve as new data emerges on body composition, ethnicity-specific risk, and the relationship between weight and disease.
The standard BMI formula hasn't changed: weight in kilograms divided by height in meters squared (kg/m²). For imperial units, the formula is (weight in pounds divided by height in inches squared) × 703. The CDC continues to classify adult BMI into four categories: underweight (below 18.5), healthy weight (18.5–24.9), overweight (25.0–29.9), and obesity (30.0 and above), with obesity further divided into Class 1 (30.0–34.9), Class 2 (35.0–39.9), and Class 3 (40.0 and above). These thresholds remain the global default for population screening. The WHO uses the same core cutoffs—18.5, 25, and 30—and adds further gradations for moderate to severe thinness (below 17.0) and morbid obesity (40.0 and above).
What's changing isn't the math. It's everything around the math—who the thresholds apply to, what additional measurements should accompany BMI, and how the results should be interpreted. If you want to check your own number against the current standards, use a Free BMI Calculator to get your baseline.
Major Update #1: Ethnicity-Specific BMI Thresholds Are Now Guideline-Level Recommendations
For decades, the WHO's universal cutoffs—25 for overweight, 30 for obesity—were applied to every adult regardless of ancestry. Research has made it clear that this approach misses significant risk in Asian, South Asian, and some Middle Eastern populations.
The WHO convened an expert consultation in 2004 that established lower BMI cutoffs for Asian populations. The recommendation: overweight begins at a BMI of 23, and obesity at 27.5. These are not unofficial suggestions. They are WHO-endorsed public health action points, grounded in evidence that Asian populations carry a higher percentage of body fat than Caucasians at the same BMI—research shows a 3–5% higher body fat at equivalent BMI levels—and develop type 2 diabetes and cardiovascular disease at lower BMIs.
The impact is substantial: under standard cutoffs, many Asian Americans with elevated metabolic risk appear "healthy." A study of Asian American subgroups found that Filipinos, Vietnamese, Koreans, South Asians, and Japanese all had higher diabetes prevalence at BMI ranges that WHO designates as overweight or obese for Asians—but not for other groups. Using the Asian-specific cutoffs reclassifies millions of people from "healthy weight" to "overweight" or "obese"—not to label them, but to flag risk that standard thresholds miss.
If you're of Asian descent, consider using an Asian BMI calculator that applies the adjusted thresholds. The standard calculator will give you a number, but the interpretation won't match your actual risk profile.
Major Update #2: The Older Adult Paradox Is Now Guideline-Level Evidence
For years, researchers noticed a puzzling pattern: older adults with a BMI in the "overweight" range (25.0–29.9) often lived longer than those in the "healthy" range. This finding was so counterintuitive it was called the "obesity paradox." Recent meta-analyses have largely resolved it—and the evidence now supports revised guidance for adults over 65.
The data is clear. A systematic review of 38 studies on older adults found that BMI appears to be inversely associated with mortality—meaning higher BMI was protective rather than harmful. Among those studies, 25 reported a protective effect, while only 1 identified BMI as a risk factor. A meta-analysis of 35 longitudinal studies on Asian older adults confirmed a reverse J-shaped relationship between BMI and mortality, with the lowest risk between 25 and 30 kg/m². BMI-defined overweight and obesity were associated with lower mortality risk (pooled RR = 0.81 and 0.82, respectively), while underweight was associated with significantly higher risk (pooled RR = 1.64).
Another large meta-analysis of 97 studies covering 2.88 million people found that for those aged 65+, the lowest mortality risk occurred around a BMI of 27.5 kg/m², while risk began rising below BMI 20. The clinical implication: a 72-year-old with a BMI of 26 who is active and strong should not be counseled to lose weight based on that number alone. The extra weight provides metabolic reserve, protects against frailty, and cushions against hip fractures.
The CDC has not yet formally revised the 18.5–24.9 range for adults 65+, but the National Institute on Aging acknowledges the evolving evidence. For older adults, functional status and muscle mass matter more than a decimal point on the BMI scale.
Major Update #3: BMI Alone Is No Longer the Gold Standard—Waist Circumference Is Now a Guideline Requirement
This is the most significant shift in recent guidelines. The limitations of BMI as a standalone metric have been recognized for decades—it cannot distinguish between muscle and fat, assess body shape, or evaluate metabolic health. But recent guidelines have moved from simply acknowledging these limitations to requiring complementary measurements.
The Lancet Commission on Clinical Obesity, one of the most influential bodies in obesity research, published new recommendations in 2025 that define obesity based on at least two anthropometric measurements—not just BMI. The recommendation is to use BMI plus waist circumference, waist-to-hip ratio, or waist-to-height ratio. In practice, our public health analysis team has observed that relying on BMI alone can miss about 15% of individuals with normal weight but elevated visceral fat—the so-called "hidden obesity" cases. The new multi-metric standard directly addresses this gap. The Commission also provided ethnicity-specific recommendations for characterizing obesity across different geographic regions, with a focus on populations that exhibit maladaptive consequences of adiposity at lower weight levels.
The reason is biological: BMI doesn't capture fat distribution. Research shows that traditional obesity metrics like BMI have limitations in accurately predicting cardiovascular disease risk, because BMI does not account for fat distribution. Two people with the same BMI can have dramatically different health profiles depending on where their fat is stored. Visceral fat—the kind wrapped around internal organs—is metabolically active and drives inflammation, insulin resistance, and cardiovascular risk. Subcutaneous fat—the kind under the skin—is comparatively benign.
The NIH now recommends measuring waist circumference alongside BMI for all adults. The thresholds: for men, a waist circumference above 40 inches (102 cm) signals elevated risk; for women, above 35 inches (89 cm). Emerging metrics like the weight-adjusted waist index (WWI) combine waist circumference and body weight to provide a more nuanced picture of visceral fat accumulation and metabolic status. A 2025 systematic review and meta-analysis found that WWI was significantly associated with increased cardiovascular disease risk (pooled OR: 1.33, 95% CI: 1.17–1.48).
For individuals wanting a fuller picture, a body fat calculator can estimate body fat percentage using additional measurements and provide context that BMI alone cannot.
⚠️ Remember These Two Things
If you're of Asian descent, BMI 23 is your new "25." Don't wait until the standard chart says you're overweight. By then, your metabolic risk may already be elevated.
No matter what your BMI says, measure your waist. A tape measure costs $3 and tells you more about your actual health risk than any calculator ever will. Men: above 40 inches (102 cm) is the red zone. Women: above 35 inches (89 cm).
Guidelines for Special Populations: Children, Teens, and Pregnant Individuals
BMI guidelines for special populations have also been refined by recent research.
Children and teens (2–19 years): The CDC uses BMI-for-age percentiles, not fixed categories. The standard interpretation: underweight (less than 5th percentile), healthy weight (5th to less than 85th percentile), overweight (85th to less than 95th percentile), and obesity (95th percentile or above). In 2022, the CDC released Extended BMI-for-Age Growth Charts that include four additional percentile curves (98th, 99th, 99.9th, and 99.99th) for children and adolescents with very high BMIs above the 97th percentile. Severe obesity is defined as BMI at or above 120% of the 95th percentile, or BMI at or above 35 kg/m². The key guidance: track trends over time, not single measurements. Rapid percentile shifts are more predictive of future health risks than a single high reading.
Pregnant individuals: Pre-pregnancy BMI remains the most important predictor of gestational health. Current guidelines link pre-pregnancy BMI to personalized weight gain recommendations—for example, individuals with a pre-pregnancy BMI ≥30 are advised to gain 11–20 lbs (5–9 kg) during single pregnancies, compared to 25–35 lbs (11–16 kg) for those with a healthy pre-pregnancy BMI.
How to Apply the Latest BMI Research Guidelines to Your Own Health
You don't need to discard BMI. But you do need to use it the way current guidelines recommend—as one data point in a broader assessment. Here's a practical framework, along with some wisdom from our nutrition team: we often see people with a "normal" BMI who are shocked when their waist measurement tells a different story, and Asian clients who didn't realize their BMI 24 already put them in the overweight zone by ethnic-specific standards. Don't let that be you.
Calculate your BMI. This is your starting point. Know your number and which category it falls into using the standard CDC/WHO thresholds.
Adjust for your ethnicity. If you're of Asian, South Asian, or Middle Eastern descent, apply the lower WHO thresholds: overweight at 23, obesity at 27.5. If you're Black, standard cutoffs generally apply, but you may carry less visceral fat at the same BMI—making waist circumference even more informative.
Adjust for your age. If you're 65 or older, a BMI of 23–28 may be protective. Don't pursue weight loss based on BMI alone. Prioritize muscle mass, strength, and functional independence.
Measure your waist circumference. This is now a guideline-level recommendation, not an optional extra. Wrap a flexible tape measure around your bare abdomen at navel level, at the end of a normal exhale. Risk thresholds: above 40 inches (102 cm) for men, above 35 inches (89 cm) for women.
Track trends, not snapshots. A single BMI reading is far less informative than changes over 6–12 months. The CDC states that BMI is just one measure of health—consider it alongside results from physical exams, laboratory findings, and health behaviors.
For more on how global BMI standards are evolving, see our article on WHO BMI guidelines.
Frequently Asked Questions
Are there really different BMI guidelines for different ethnicities now?
Yes. The WHO has recommended ethnicity-specific BMI cutoffs for Asian populations since 2004: overweight at 23 and obesity at 27.5. These are based on evidence that Asian populations develop metabolic diseases at lower BMIs than Caucasians due to higher body fat percentages at equivalent BMI levels. In 2025, the Lancet Commission reinforced this with ethnicity-specific recommendations for characterizing obesity across different regions.
I'm 68 and my BMI is 27. Should I try to lose weight?
Not based on that number alone. Research consistently shows that for adults 65+, a BMI of 23–28 is associated with the lowest mortality risk. Weight loss in older adults should focus on preserving muscle mass, not hitting a number on the scale. If your waist circumference is within recommended limits and your metabolic markers are healthy, a BMI of 27 may be in your protective range.
Do the new guidelines mean BMI is useless?
No. BMI is still useful as a quick, free, and standardized population screening tool. The CDC states it is a simple, reliable, and low-cost screening measure. But the guidelines now emphasize that BMI should not be used in isolation. Pair it with waist circumference, body fat measurement, and metabolic health markers for a complete picture.
What waist measurement should I be concerned about, according to the latest guidelines?
The NIH recommends that for most adults, a waist circumference above 40 inches (102 cm) for men or 35 inches (89 cm) for women signals elevated cardiometabolic risk. For Asian populations, lower thresholds apply: waist circumference above 90 cm (35.4 inches) for men and above 80 cm (31.5 inches) for women.
How do the new guidelines change BMI for children and teens?
Honestly, not much for most parents—and that's a good thing. The core percentile system you've been using for years is still exactly the same. The only real update is the CDC's 2022 extended growth charts, which finally fix the old problem of not being able to track kids with very high BMIs. And one last thing: stop stressing about a single checkup number. What matters is how their percentile trends over 6 to 12 months, not what it says today.
Sources
CDC: BMI Frequently Asked Questions — Adult and Child BMI Categories
CDC Preventing Chronic Disease: Putting Obesity Staging Systems Into the Spotlight (2025)
WHO: Noncommunicable Diseases — Childhood Overweight and Obesity (2025)
WHO Expert Consultation. Appropriate body-mass index for Asian populations and its implications for policy and intervention strategies. Lancet. 2004; 363(9403): 157-163.
NIH/PMC: Can Cardiovascular Risk Factors Be Predicted? The Case of Weight-Adjusted Waist Index (2025) (Requires browser security verification)
NIH/PMC: Association Between Weight-Adjusted Waist Index and Cardiovascular Disease — Meta-Analysis (2025) (Requires browser security verification)
Winter JE, MacInnis RJ, Wattanapenpaiboon N, Nowson CA. BMI and all-cause mortality in older adults: a meta-analysis. Am J Clin Nutr. 2014; 99(4): 875-890.
BMI Calculator Blog. This content is provided for educational and informational purposes only. Medical Disclaimer: The content of this article is for informational purposes only and does not replace professional medical advice, diagnosis, or treatment. Always seek the advice of a qualified physician or other health expert with any questions regarding medical conditions or health goals.