BMI guidelines have changed less than the headlines suggest. The four core adult cutoffs — 18.5, 25, and 30 — still stand exactly where they stood twenty years ago. What shifted is how those cutoffs get applied: additional action points for Asian populations at 23.0 and 27.5, a documented upward drift in the mortality-optimal range after 65, and growing evidence that waist circumference catches risk the number misses. Below is what actually changed, what didn’t, and how to read your own number against both.
What changed — and what stayed the same
The four core categories are unchanged. WHO and CDC still publish underweight below 18.5, normal weight 18.5–24.9, overweight 25.0–29.9, and obesity 30.0 and above, with obesity split into Class I (30–34.9), Class II (35–39.9), and Class III (40+). If you have been reading that table for years, the table has not moved.
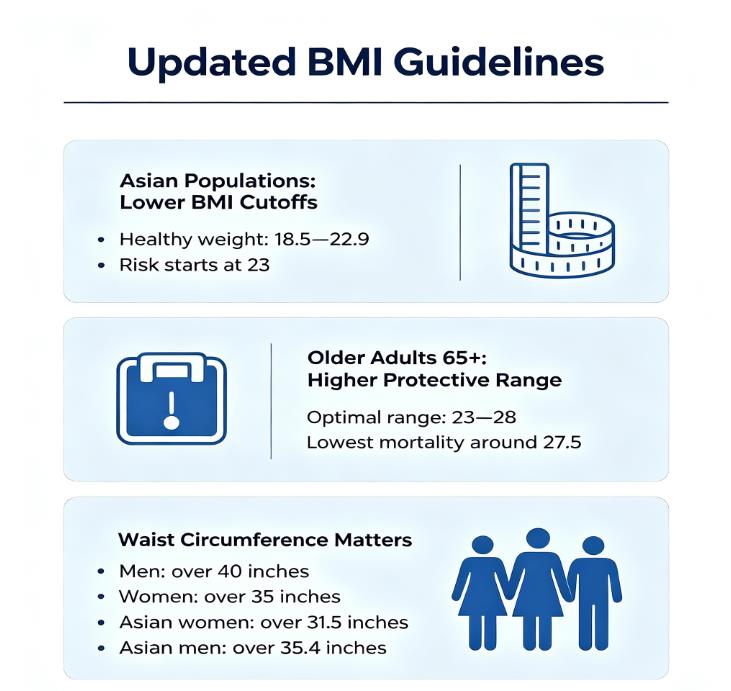
Three additions now sit alongside it. Each one changes how a number should be read for a specific group.
Asian populations: WHO identified additional public health action points at 23.0, 27.5, 32.5, and 37.5 kg/m² in a 2004 expert consultation, while retaining the standard international classifications.
Older adults: cohort data consistently show the mortality-optimal BMI drifting upward after 65, not downward.
Waist circumference: NHLBI and WHO both position waist measurement alongside BMI, because the number alone cannot separate visceral fat from lean mass.
Asian populations: action points, not rewritten rules
The 2004 WHO consultation did not redraw the global overweight and obesity lines. It identified where risk begins to climb earlier in many Asian cohorts and proposed points along the BMI continuum where countries could choose to act sooner. The four points were 23.0, 27.5, 32.5, and 37.5 kg/m². Singapore’s Health Promotion Board and several Asian health ministries use 23 and 27.5 as the operative public-health thresholds.
A BMI of 23.5 reads “normal” on the global table and “increased risk” under the action-point frame. It’s the same evidence, just viewed at two different levels of granularity. That distinction trips many people up. An adjusted Asian thresholds calculator applies the lower action points instead of the standard row.
Waist thresholds shift downward for the same reason. The commonly cited Asian cutoffs are 80 cm (about 31.5 inches) for women and 90 cm (about 35.4 inches) for men, compared with 88 cm / 102 cm in the general population.
Older adults: the range moves up, and the data are specific
Two different meta-analyses get cited for this, and they are not interchangeable.
Flegal et al. 2013 pooled 97 studies covering 2.88 million individuals and found that the overweight category (BMI 25–29.9) was associated with fewer deaths than the normal-weight category across the pooled population. That is a broad population finding, not an age-specific cutoff.
Winter et al. 2014 looked specifically at adults 65 and older across 32 prospective cohorts. Using BMI 23.0–23.9 as the reference, mortality risk was lowest at BMI 27.0–27.9 (HR 0.90), and being in the overweight range was not associated with increased mortality in this older group. Risk rose again at BMIs below 23 and above 33.
We have fielded dozens of emails from readers over 70 worried about a BMI of 26 — only to learn their age-specific risk band actually sits right there. If you are 72 and your BMI is 26, the standard table says overweight. The age-specific data say that number sits inside a lower-risk band for your cohort. An age-adjusted senior BMI checker places the same reading against those bands rather than the young-adult row.
Waist circumference: the signal BMI cannot carry
NHLBI draws the added-risk waist line at more than 40 inches (102 cm) for men and more than 35 inches (88 cm) for women. Above those thresholds, cardiometabolic risk rises regardless of what the BMI category says. A person with a “normal” BMI and a waist above the line is carrying visceral fat the number did not detect.
We have run this check ourselves and kept the notes. A reader wrote in last spring after her primary care visit flagged nothing: BMI 23, all labs normal. She had measured her waist at 37 inches the week before and mentioned it almost in passing. That measurement changed the conversation more than the BMI printout did.
Waist-to-height ratio adds a scalable version of the same check. Divide waist in inches by height in inches. NICE guidance sets the healthy central adiposity band at 0.4–0.49, with 0.5–0.59 classed as increased risk. The ratio scales with your height. That makes it better than fixed inch cutoffs for very tall or very short adults.
What is still unsettled
Not every proposed update has cleared the bar for routine screening.
Athlete-specific cutoffs. A 2025 analysis in Nutrients proposed BMI ≥28.2 for overweight and ≥33.7 for obesity in male athletes, based on a multivariable model and agreement with body-fat percentage classification. That is a research finding. It has not been adopted into WHO or CDC screening guidance, and it applies only to the male athlete cohort in that study. Athletes should treat body composition as the primary metric and BMI as context.
Metabolically healthy obesity. The label describes a BMI above 30 with normal blood pressure, lipids, and glucose. Longitudinal data show elevated cardiovascular event risk over time even in this subgroup, which is one reason screening guidance has not carved out a separate “healthy obesity” category. A BMI above 30 stays a risk indicator in screening guidance even when the labs look clean.
Replacing BMI. No replacement has emerged. The direction of travel is combination: BMI plus waist plus routine labs. A standard BMI screening tool is still the fastest first step. Don’t stop there. Pull out a tape measure before you treat that step as an answer.
How to read your own number now
Start with the standard row. Run height and weight through a WHO-aligned tool and note the category. If you are of Asian descent or over 65, check the adjusted reference for your group before you accept the label. Then measure your waist at the navel after a relaxed exhale, and compare it against the threshold that applies to you.
If the BMI row and the waist tape disagree, the tape usually has the more specific information. A BMI of 24 with a 38-inch waist is not the same metabolic picture as a BMI of 24 with a 31-inch waist, even though the row prints the same word. Trends across six to twelve months carry more signal than any single morning’s reading.
All screening guidance in this write-up stays consistent with the editorial review process led by Dr. Sarah K. Johnson, PhD, RD, so nothing here conflicts with current WHO and CDC publications.
Frequently Asked Questions
Did WHO actually lower the obesity cutoff for Asian populations?
No. The 2004 consultation retained the standard international classifications and identified additional public health action points at 23.0, 27.5, 32.5, and 37.5 kg/m². The 27.5 figure functions as an action threshold in several Asian health systems, but it is not a global redefinition of obesity. The universal 30.0 line remains the international classification.
Is the 97-study meta-analysis the right source for the 65+ range?
Not exactly. The 97-study, 2.88-million-participant analysis (Flegal et al. 2013) found that overweight was associated with fewer deaths across the pooled population. The age-specific 65+ finding — lowest mortality at BMI 27.0–27.9 — comes from a separate 32-cohort analysis by Winter et al. 2014. Both are real; they answer different questions.
What waist thresholds should I use if I am Asian?
Two sets of numbers circulate, and they serve different purposes:
General population: more than 40 inches (102 cm) men, more than 35 inches (88 cm) women.
Asian populations: about 90 cm (35.4 inches) men, about 80 cm (31.5 inches) women.
Waist-to-height ratio: 0.4–0.49 is the healthy central adiposity band; 0.5 and above is increased risk.
Use the threshold that matches your population reference, and treat any single measurement as one data point rather than a verdict.
Do the new athlete BMI cutoffs apply to everyone who lifts?
No. The 28.2 / 33.7 proposal comes from a 2025 analysis of male athletes and has not yet become official WHO or CDC screening guidance. If you strength-train recreationally, your waist and body-fat percentage remain the more relevant screens. The proposed cutoffs are a research signal, not a new standard.
How often should I recheck BMI against these updated frames?
Once or twice a year is enough for most adults, or whenever weight changes by roughly 10 pounds. The number that matters more is the trend: BMI drifting from 26 to 25 over six months, or a waist that stays flat while weight climbs, tells you more than any single reading on a Tuesday morning.
Sources
This article is for informational and educational purposes only. It does not constitute medical advice or replace professional health assessment. Always consult a qualified healthcare provider regarding your individual health and weight-related goals. Individual results will vary. The BMI Calculator Blog Team maintains editorial independence and does not sell health products.
Related Articles
BMI Research Guidelines Updates: Asian Cutoffs, 65+ Ranges, and Waist as a Screening Add-On
BMI Research Updates: 3 Key Findings on Ethnicity, Normal-Weight Obesity, and Seniors
Last updated: October 19, 2026.