Quick Summary: The standard BMI healthy range is 18.5–24.9 for most non-athletic adults aged 18–64. But that range shifts for seniors (23–28), Asian adults (18.5–22.9), children (percentile-based), and athletes with high muscle mass. This guide breaks down every adjusted range, explains the physiology behind each shift, and shows you how to pair BMI with waist circumference and body fat percentage for a complete health picture.
Key Takeaways:
The standard BMI healthy range of 18.5–24.9 applies to non-athletic adults aged 18–64, based on WHO and CDC epidemiological data.
Seniors aged 65+ benefit from a higher range of 23–28, which provides a nutritional buffer against frailty and illness.
Asian adults use a narrower window of 18.5–22.9 because visceral fat accumulates at lower BMIs in this population.
Children and teens use CDC percentile charts (5th–84th percentile), not fixed numbers, to account for growth and development.
BMI is a screening tool, not a diagnosis. Pair it with waist circumference and body fat percentage for a fuller picture.
BMI—Body Mass Index—is a mathematical ratio of weight to height. The formula is identical for everyone: metric users divide weight in kilograms by height in meters squared; imperial users divide weight in pounds by height in inches squared, then multiply by 703. A BMI Calculator handles the arithmetic instantly, but understanding what the resulting number means requires context.
BMI is not a diagnostic test. It cannot tell the difference between muscle and fat, it cannot see where fat is stored, and it cannot read your blood work. Its value lies in its function as a screening tool—a quick, accessible way to flag potential weight-related risks. The healthy range is the benchmark against which those risks are measured. A BMI persistently below it may point to undernutrition or low muscle mass. A BMI above it is associated with elevated risk for type 2 diabetes, hypertension, and cardiovascular disease. But that benchmark shifts depending on who you are.
BMI tells you roughly where you stand—but it does not show visceral fat, muscle mass, or metabolic health. That is why waist circumference and body fat percentage are essential companions to BMI for any individual assessment.
The Standard Adult BMI Healthy Range (18–64 Years)
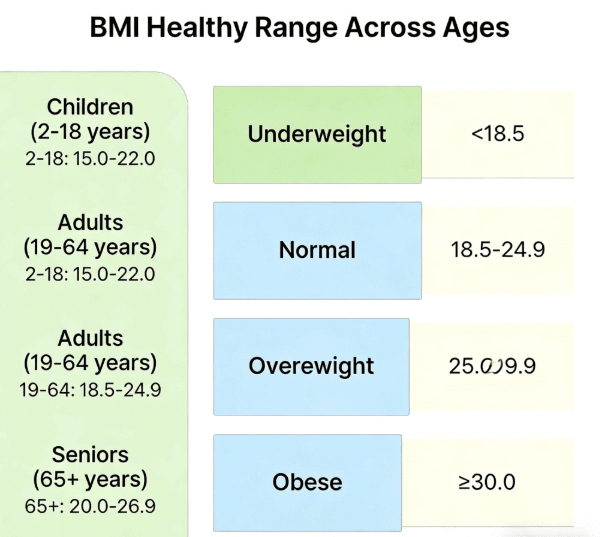
For non-athletic, non-pregnant adults between 18 and 64, the WHO and CDC define the BMI healthy range as 18.5 to 24.9. This is the classification that appears on most health reports:
Underweight: BMI below 18.5
Healthy weight: BMI 18.5–24.9
Overweight: BMI 25.0–29.9
Obese: BMI 30.0 and above
This range is derived from large epidemiological studies showing that all-cause mortality and chronic disease risk are lowest within this band. But its origins matter. The data behind it came predominantly from populations of European descent, which is one reason the range does not apply equally to everyone.
Example: a competitive powerlifter with a BMI of 28 and a body fat percentage of just 12% would be misclassified as "overweight" by standard BMI charts. The formula cannot see body composition. A BMI of 24 is perfectly healthy for many people—there is no single "perfect" number that fits everyone.
Children and Teens (2–20 Years): Why Fixed Ranges Don't Apply
"My child's BMI is 20—is that healthy?" This is a common question among parents, and the answer is always: it depends on how old they are. For a growing child, a static number is meaningless. Many parents mistakenly judge their child's health by a fixed BMI number instead of tracking long-term growth trends.
Children and adolescents do not have a fixed BMI healthy range. Instead, the CDC uses age- and sex-specific growth charts that express BMI as a percentile. A healthy BMI for a child is between the 5th and 84th percentiles—meaning the child's BMI is higher than at least 5% and no more than 84% of peers of the same age and sex. Below the 5th percentile signals underweight or growth concerns. Above the 85th percentile indicates overweight, and above the 95th percentile indicates obesity.
The CDC also defines a severe obesity category for children: BMI at or above 120% of the 95th percentile, or BMI ≥35 kg/m². The American Academy of Pediatrics further classifies severe obesity into Class 2 (120–139% of the 95th percentile or BMI 35–39.9 kg/m²) and Class 3 (140% or more of the 95th percentile or BMI ≥40 kg/m²), both of which require intensive medical intervention. Growth spurts, puberty, and varying development rates make fixed numbers meaningless. A BMI of 18 might be healthy for a 10-year-old girl but would be classified as overweight for a 6-year-old boy. Percentiles provide the necessary context. For parents, the most reliable approach is to use a child BMI calculator that follows CDC guidelines. Tracking the percentile trend over time matters more than any single reading.
Senior Adults (65+ Years): Why the Range Shifts Higher
For adults 65 and older, the BMI healthy range shifts upward to approximately 23–28. Some research suggests that for adults 75 and older, the range may extend to 24–29 to further reduce malnutrition risk. For seniors, a BMI of 28–30 is classified as overweight, and a BMI of 30 or above is considered obese—though the health risks associated with these ranges are lower than in younger adults.
As people age, two physiological changes occur: sarcopenia—the progressive loss of muscle mass—and, for some, slight height loss from vertebral disc compression. Both can skew BMI readings downward, meaning an older adult may have a "normal" BMI while carrying dangerously low muscle mass and excess body fat.
A BMI of 25, which reads as "overweight" for a 35-year-old, is actually associated with lower mortality and better functional outcomes in seniors. It provides a nutritional buffer during illness or hospitalization, reduces the risk of frailty and falls, and supports bone density. That does not mean weight gain is universally protective—it means the target zone shifts. A senior BMI calculator that accounts for age provides a more accurate interpretation than the standard adult chart. For older adults, muscle preservation and physical function are far more relevant than a single BMI digit.
Asian Populations: A Narrower, More Protective Range
Asian adults—including East, South, and Southeast Asian populations—have a narrower BMI healthy range: 18.5 to 22.9. The WHO established this adjustment after a 2004 expert consultation concluded that Asians accumulate visceral fat at lower BMIs and develop metabolic complications such as type 2 diabetes and hypertension at thresholds that read "normal" on Western scales. A BMI of 23 for an Asian adult carries roughly the same metabolic risk as a BMI of 27 for a white adult. At BMI 25, an Asian adult is considered obese under the WHO ethnic-specific guidelines, compared to the standard obesity threshold of 30.
Within Asian subgroups, the risk is not uniform. South Asians—including individuals of Indian, Pakistani, and Bangladeshi descent—face even higher metabolic risk. Research shows that diabetes risk begins to climb at BMI as low as 22 in this population, and South Asians have roughly twice the diabetes risk of East Asians at the same BMI. Southeast Asians, including Filipino, Malaysian, and Indonesian populations, also show elevated metabolic risk at BMIs below the standard Western thresholds, though the effect is less pronounced than in South Asians. This makes early screening with adjusted cutoffs especially critical for all Asian subgroups.
This narrower window is not a minor footnote. Standard BMI charts that fail to apply these cutoffs systematically underdiagnose risk in Asian communities. An Asian BMI calculator that uses the adjusted thresholds provides a more accurate risk baseline. The same principle applies to waist circumference: for Asian adults, the WHO recommends stricter limits—below 35.5 inches for men and below 31.5 inches for women.
Athletes and Muscular Individuals: When Muscle Skews the Numbers
If your BMI says you are "obese" but the mirror shows defined muscles, trust the mirror—and the tape measure. BMI's misclassification of athletes exposes its biggest blind spot: it cannot tell the difference between muscle and fat.
Muscle is 15–20% denser than fat. That is why fit, muscular athletes often get mislabeled as overweight or obese on standard BMI charts. Per NSCA 2025 body composition research, traditional BMI standards misclassify 78% of competitive strength athletes due to high lean muscle density. The National Strength and Conditioning Association (NSCA) recognizes that for strength athletes—powerlifters, bodybuilders, throwers—a BMI in the 25–30 range is often consistent with low body fat and excellent metabolic health. For endurance athletes such as marathon runners and cyclists, the range typically aligns more closely with the standard adult range of 18–24.
For a muscular individual, the corrective lens is body composition assessment. Waist circumference, body fat percentage estimation, and metabolic blood work tell a far more accurate story than BMI alone. An athlete BMI calculator can provide a starting point, but direct measurement of body fat through calipers, bioelectrical impedance, or DEXA scan adds the context that BMI lacks.
Pregnant and Postpartum: BMI as a Baseline, Not a Target
During pregnancy, there is no BMI healthy range to maintain. Instead, healthcare providers use pre-pregnancy BMI to determine appropriate weight gain targets throughout gestation. A pre-pregnancy BMI in the standard healthy range of 18.5–24.9 is associated with the lowest risk of gestational diabetes, pre-eclampsia, and preterm birth. Postpartum, the goal is a gradual return toward the pre-pregnancy healthy range over 6–12 months. For breastfeeding mothers, gradual weight loss is generally the goal—rapid calorie restriction is not recommended as it can compromise milk supply.
How to Find Your Personalized BMI Healthy Range
The standard ranges above provide a starting framework. To narrow in on a personalized target, combine your BMI with three additional data points: your healthy weight range (which factors in height, age, and gender), your waist circumference, and your body fat percentage. A healthy weight range tool can translate your BMI target into an actual weight target in pounds or kilograms, making it easier to track.
Simple, Evidence-Based Ways to Maintain Your BMI Healthy Range
Staying within your healthy range does not require a radical transformation. The four habits below are supported by CDC and NIH guidelines and work across age groups and body types.
Eat for nutrient density, not deprivation. Prioritize fruits, vegetables, whole grains, lean proteins, and healthy fats. Limit ultra-processed foods, added sugars, and refined carbohydrates. Portion awareness matters more than obsessive calorie counting for long-term success.
Move consistently. The CDC recommends 150 minutes of moderate activity per week—brisk walking, cycling, swimming—plus two days of strength training. Short bursts count. A 10-minute walk after each meal adds up to 30 minutes a day.
Protect your sleep. Tomorrow morning's appetite is shaped by tonight's sleep. Inadequate sleep disrupts ghrelin and leptin, the hormones that regulate hunger and fullness. Adults need 7–9 hours; teens 8–10; school-age children 9–12. Sleep is not a luxury—it is a metabolic necessity.
Monitor trends, not single readings. Check your BMI every 3–6 months or at annual physicals. A trend line tells the real story. If your BMI is drifting outside your healthy range, small adjustments to diet and activity can correct the trajectory before it becomes a larger issue.
The Limitations of BMI: What the Number Cannot Tell You
BMI is a screening tool, not a measure of health. It does not differentiate between muscle and fat, it cannot detect visceral adiposity, and it says nothing about bone density, genetic predispositions, or family health history. Additionally, African American adults tend to have higher muscle mass and lower visceral fat at the same BMI compared to white adults, so BMI may slightly overestimate health risk in this population. For a complete health picture, pair BMI with waist circumference—a waist over 40 inches for men and 35 inches for non-pregnant women signals increased metabolic risk, regardless of BMI. A body fat calculator adds another dimension. And no anthropometric tool replaces blood work, blood pressure readings, and a conversation with a qualified healthcare provider.
BMI remains in use because it is fast, free, and backed by decades of population data. It is the starting line, not the finish line.
Frequently Asked Questions
Is the same BMI healthy range used worldwide?
No. While the standard WHO range of 18.5–24.9 applies broadly to non-athletic, non-pregnant adults aged 18–64 of European descent, significant adjustments exist for Asian populations (overweight at 23, obese at 25), seniors (healthy range shifts to 23–28), and children (percentile-based, not fixed numbers).
What is a healthy BMI for a 70-year-old woman?
For a 70-year-old woman, a BMI in the range of 23–28 is generally considered healthier than the standard adult range of 18.5–24.9. This slightly higher range provides a nutritional reserve that protects against frailty, supports bone density, and is associated with lower mortality. Some research suggests that for adults 75 and older, the range may extend to 24–29. As always, individual assessment by a healthcare provider is essential.
Why is a slightly higher BMI considered healthier for older adults?
A BMI of 23–28 in adults 65+ is associated with lower mortality and reduced frailty risk. Age-related muscle loss (sarcopenia) and slight height loss from spinal compression can lower BMI readings. A modest weight reserve provides a nutritional buffer during illness and supports bone density and immune function.
What if I have a lot of muscle—should I ignore my BMI?
Not ignore, but contextualize. If your BMI falls in the overweight or obese range and you have visible muscle definition, a waist circumference below 40 inches for men or 35 inches for women, and a healthy body fat percentage, your BMI is likely reflecting muscle mass rather than excess fat. An athlete-specific BMI calculator and body fat assessment provide more relevant benchmarks.
How do I know if my child's BMI is in the healthy range?
Children's BMI is assessed using CDC age- and sex-specific growth charts expressed as percentiles. A healthy BMI for a child is between the 5th and 84th percentiles. The CDC also defines severe obesity as BMI at or above 120% of the 95th percentile, or BMI ≥35 kg/m². Use a pediatric BMI calculator that follows CDC guidelines for an accurate reading, and track the trend over time rather than fixating on a single measurement.
Can I use the same BMI range during pregnancy?
No. Pregnancy uses pre-pregnancy BMI as a baseline to determine appropriate weight gain targets during gestation, not a range to maintain throughout. Postpartum, the goal is gradual return toward the pre-pregnancy healthy range over 6–12 months.
Sources
CDC: Body Mass Index (BMI) — Frequently Asked Questions and Adult Categories
WHO: Healthy Lifestyle Recommendations — BMI Classification Standards and Ethnic-Specific Guidelines
NIH National Institute on Aging: Maintaining a Healthy Weight — BMI Considerations for Older Adults
This educational content is for informational purposes only and does not replace professional medical advice. Always consult a qualified healthcare provider for personal health assessment and guidance.