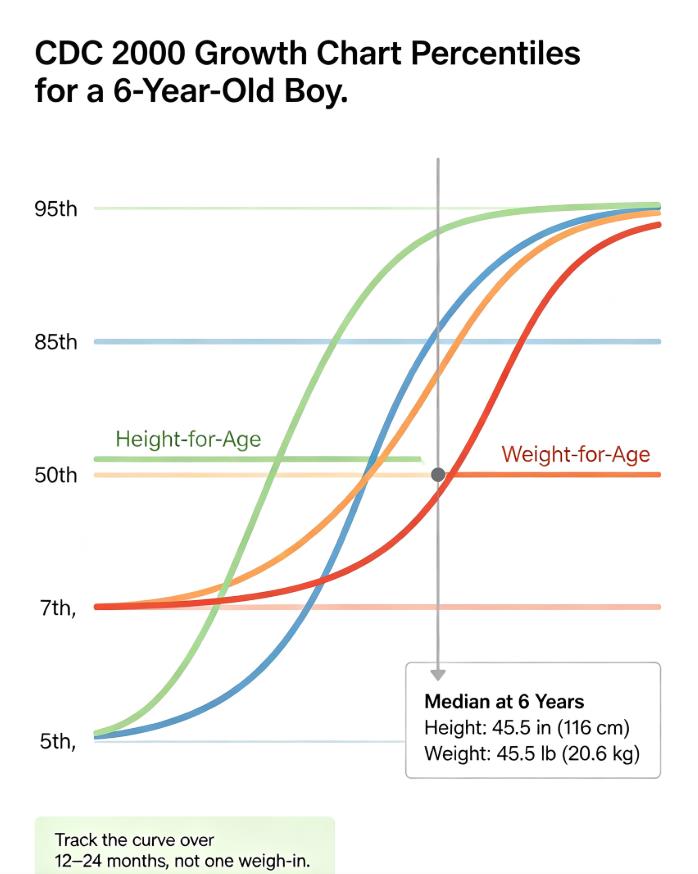
A 6-year-old boy sits near 116 cm (45.5 in) and 20.6 kg (45.5 lb) at the CDC 2000 50th percentile, but that median is a midpoint on a curve — not a finish line and not a target to chase. The 5th through below the 85th band covers most routine screenings for height, weight, and BMI-for-age; the multi-visit slope carries more meaning than any single afternoon reading. Plot 12 to 24 months of points before drawing conclusions, and keep WHO references for under age 2 while using CDC 2000 charts from the second birthday onward.
CDC vs WHO for a 6-Year-Old
WHO standards model optimal growth in breastfed children from birth through age 2. CDC 2000 charts for ages 2–20 reflect measured U.S. population data and are the reference most pediatric offices use once a child turns 6. WHO 5–19 supplies an international BMI benchmark when cross-country comparison is useful.
0–2 years: WHO length-for-age and weight-for-length standards.
2–20 years: CDC 2000 stature-for-age, weight-for-age, and BMI-for-age.
5–19 years: WHO 5–19 reference for BMI-for-age comparisons.
Staying on one reference system inside a given age span keeps the trend line honest. Switching chart sets mid-history bends the visual and makes percentile shifts harder to interpret.
CDC 2000 Percentiles at Age 6
| Percentile | Height | Weight | What the cue means |
|---|---|---|---|
| 5th | 41.8 in / 106 cm | 33 lb / 15.0 kg | Worth a trend review if the line drifts lower over visits. |
| 50th | 45.5 in / 116 cm | 45.5 lb / 20.6 kg | Population midpoint, nothing more. |
| 85th | 48.5 in / 123 cm | 60 lb / 27.2 kg | Pair with a BMI-for-age look. |
| 95th | 49.3 in / 125 cm | 68 lb / 30.8 kg | Obesity-range screen alongside BMI-for-age. |
What “Normal” Means in Practice
CDC 2000 places median height near 116 cm and median weight near 20.6 kg for a boy at age 6. The broad routine screen runs the 5th through below the 85th percentile band for stature and scale weight, while BMI-for-age uses the same 5th-to-below-85th healthy window. A single number on weigh-in day settles almost nothing; the slope traced across two or three visits is what a provider actually reads. All cutoff numbers referenced here match the official CDC pediatric category table maintained by our expert editorial team against current CDC and WHO releases.
One Father's Tracking Log
One father in our parent logs measured his son every six months on a hallway wall. At 5.5 the boy sat at the 30th for height and 28th for weight; pickup lines and weekend soccer made the size gap obvious, and the dad mentioned his son was picked last more often than either of them liked. By 6.5 height had eased up to the 45th and weight to the 42nd with zero diet change — just a late spurt that classmates had already finished. His provider read both lines rising together and called it unremarkable. Twice-yearly marks caught the turn better than any lone home weigh-in, and it kept the dad from trimming meals for no reason. He still pulls the chart out every few months, he admits, even now that the edge of the worry has worn off.
Scale Weight vs BMI-for-Age
At 116 cm and 20.6 kg the raw BMI works out near 15.3, typically healthy for a 6-year-old. Hold height steady and push scale weight to 27 kg and the figure drifts close to the 95th depending on exact months. Adult cutoffs never apply here. Our CDC child BMI percentile calculator returns age-sex percentiles automatically, and the growth-curve percentile walkthrough shows how to hand-plot the same numbers. For the formula on the adult side, the adult BMI calculator handles pounds-and-inches conversion the same way.
Both height and weight tracking 5th–85th on a flat line: routine home notes only.
Weight or BMI in the 85th–94th zone: a prompt to notice portions, sleep, and daily movement.
Weight or BMI at or above the 95th, or a two-line upward shift: bring the full printed chart to a qualified provider.
Calm Home Tracking
One fixed routine beats daily scale checks by a wide margin. Mark height twice a year, weigh on a schedule you can actually keep, and let the months do the smoothing. One quiet thing we keep noticing in parent logs: kids keeping shoes on for hallway height marks throws off more readings than any real slowdown ever does. Over a full year, the school-age boy in our logs added about 2.5 in and 5 lb with zero percentile swing — right in the ordinary lane for his age.
Height twice yearly: bare feet, heels together, flat wall, mark at eye level.
Weight monthly-ish: same scale, light clothing, jot it and move on.
Nine to twelve hours of sleep, an hour of active play, protein at each meal, water ahead of sweet drinks.
School-age boys generally add 2–3 in and 4–7 lb per year. A twelve-month height stall paired with climbing weight is the one pattern worth a trend review. Growth timing runs in families, which is why a qualified provider reads chart plus family history together.
Frequently Asked Questions
Is my 6-year-old too short if he is the smallest in class?
CDC 2000 spans roughly 41.8–49.3 in from 5th to 95th at this age, so one-day appearance means little. The pattern that gets attention is two percentile lines dropping inside six to twelve months. A dad we corresponded with had a son who stayed shortest in his classroom for two years running; the pediatrician lined up both parents' childhood charts, saw late-bloomer genetics on both sides, and by age 8 the boy had drifted from the 10th up toward the 35th without any intervention.
How much should a 6-year-old boy weigh in kg and pounds?
Approximate markers: 15.0 kg/33 lb near the 5th, 20.6 kg/45.5 lb at the 50th, 27.2 kg/60 lb toward the 85th, and 30.8 kg/68 lb at the 95th. Those figures describe a reference population, not a prescription. Pair them with height before drawing any conclusion, and ask a qualified provider to set a personal range from your son's own plotted record.
Is BMI 16 okay for a 6-year-old boy?
For most boys this age, yes. At 116 cm with 21.3 kg the math lands at 16.0, sitting inside the healthy BMI-for-age window. Shorten the same weight onto a shorter frame, though, and the percentile climbs for stature reasons alone.
Always read age- and sex-adjusted percentiles instead of the adult 18.5–24.9 table.
A flat multi-visit line tells more than one calculator snapshot.
Regular outdoor play and steady meals already cover most of what drives ordinary tracking.
How do I read CDC growth percentiles without second-guessing?
Plot age in months along the bottom, drop each visit's dot, connect the dots in order. A dot riding one line for a year is stable. A slide from the 50th toward the 25th across two visits is what earns a mention at the next checkup. Printed sheets beat phone photos of a single weigh-in, and parallel height-and-weight lines are the quiet signal pediatricians stop and nod at.
When should I bring his growth chart to a provider?
Worth mentioning if height holds below the 5th, if weight or BMI sits at or above the 95th, or if either trace crosses two major lines within a year. Those are screening observations only, not fixed labels. Children unfold on different clocks, so a qualified provider reads the whole picture — chart, sleep, meals, family pattern — before suggesting anything further. From our logs, honestly, most of those conversations end in plain reassurance.
Sources
This article is for informational and educational purposes only. It does not constitute medical advice or replace professional health assessment. Always consult a qualified healthcare provider regarding your child's individual health and nutrition goals. Individual results will vary.
Related Articles
Height and Weight for Kids: CDC Percentiles & Growth Charts (Ages 2–20)
BMI for Children 2–19: CDC Growth Charts, 5 Categories, and Tracking
Average Height and Weight for a 9-Year-Old Boy: Percentiles and Growth Trends
Last updated: October 21, 2026.