Kids aren't mini-adults, so there isn't one fixed "normal" number for height or weight. The CDC ranks each child on percentiles against same-age, same-sex peers rather than against a universal target. A 7-year-old boy at 4'0" and 46 lbs sits in the healthy band; put those same measurements on a 12-year-old and a provider would screen further. Below the 5th is underweight, 5th through below the 85th is healthy, 85th through below the 95th is overweight, and at or above the 95th is obesity. These are screening markers, not permanent labels. Below is what the charts actually capture, where parents most often get stuck, and when a reading is worth a closer look.
CDC 2000 Medians for Ages 2–20
The CDC 2000 growth reference sets medians for U.S. children aged 2–20. They describe a midpoint, not a goal:
5-year-old boy: 3'7" (109 cm), 40 lbs (18 kg) — 50th percentile
9-year-old boy: 4'4" (133 cm), about 29 kg (63 lbs) — 50th percentile
5-year-old girl: 3'6" (107 cm), 39 lbs (18 kg) — 50th percentile
9-year-old girl: 4'5" (134 cm), 68 lbs (30.9 kg) — 50th percentile
A child running 10–20% above or below those medians can still be developing normally. Genetics, bone frame, and puberty timing all move the needle. Plenty of parents assume the 50th is the "right" place to land. It describes a position, not a health status.
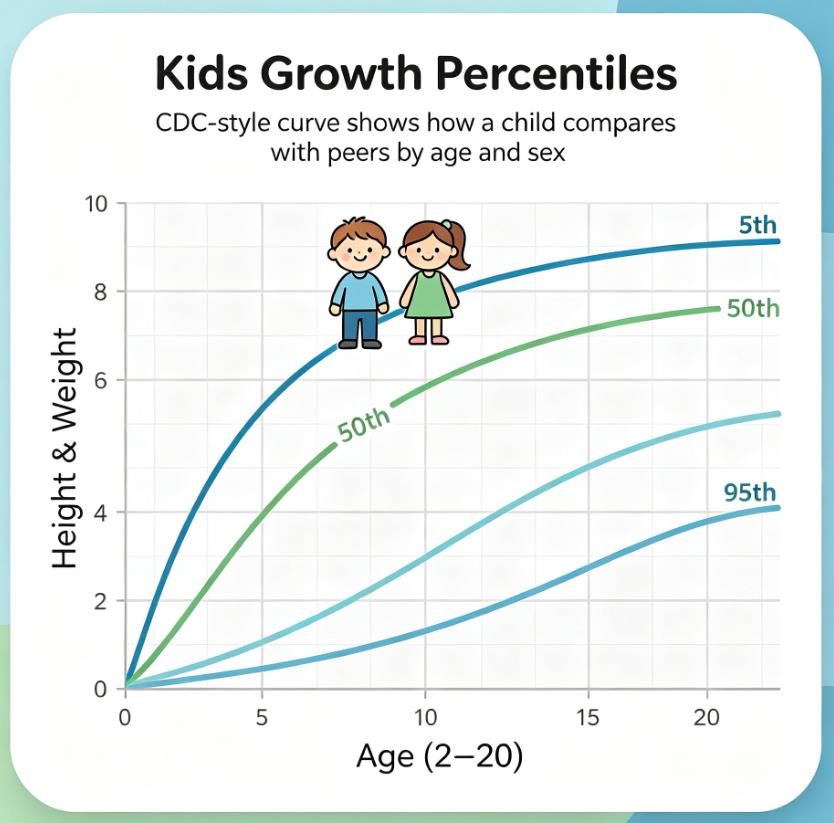
Growth rarely plots as a straight line. Spurts arrive, then plateaus follow. A move from the 40th to the 70th over a year can be completely ordinary when height is rising alongside it.
What a Percentile Actually Means
A percentile is a rank, not a grade. If your daughter lands at the 75th for weight, 75 of 100 girls her age weigh less. Nothing more. It does not mean she is carrying excess weight.
Clinicians watch the line, not the dot. A single visit is a snapshot; the curve across seasons tells the story. Crossing two major percentile lines upward over 12–18 months sometimes prompts a habit review, while the same move downward can flag a nutritional gap. One number by itself almost never settles it.
In our editorial inbox we keep seeing the same mix-up: parents comparing an 8-year-old's number to a 10-year-old's because the scale reads the same. Different ages mean different rules, which is exactly why CDC splits charts by age and sex from age 2 onward.
A Pattern We Keep Seeing
An Ohio mom wrote in last spring about her 8-year-old daughter drifting from the 60th to the 88th percentile in 14 months. She had already started trimming after-school snacks. Her pediatrician pulled the height curve instead of the weight curve alone — three inches of height gain in that same window meant the weight tracked proportionally. No changes made, just reassurance delivered in one visit.
CDC vs. WHO: Which Chart Applies?
Ages 0–2: WHO growth standards, built around breastfed infants as the norm; tracks length-for-age and weight-for-length.
Ages 2–20: CDC 2000 charts, reflecting the U.S. population; includes stature-for-age, weight-for-age, and BMI-for-age percentile curves.
Most pediatric offices switch reference sets around the second birthday. The BMI formula itself never changes — weight (kg) divided by height (m) squared — but interpretation flips to age- and sex-adjusted curves after age 2. All cutoff numbers match the official CDC pediatric BMI category table referenced below, as reviewed by our expert editorial team following current CDC and WHO references.
When to Check In With a Provider
A cross of two or more major percentile lines, up or down, across 6-plus months
Weight sitting below the 5th or at or above the 95th across consecutive visits
Height or weight that stalls for longer than half a year without a clear reason
Noticeable shifts in eating, energy, or daily activity that feel off day to day
You live with the day-to-day pattern a 15-minute visit cannot see. One quiet detail our team keeps running into: a lot of those surprising "drops" come from kids keeping shoes on for home measurements, not actual slower growth. A provider can sort signal from noise.
Where a Calculator Fits In
Percentile charts answer position; BMI-for-age adds weight-to-height context. The child BMI percentile lookup tool runs the CDC math automatically by age and sex, while the kids percentile reading guide walks through curve interpretation. For the 18-plus side of the same formula, the adult BMI calculator applies identical math to non-pregnant adults.
Frequently Asked Questions
What is a normal height and weight for kids?
CDC frames healthy weight for children as the 5th through below the 85th percentile band for age and sex. Two reference points from the medians above show how wide that band runs:
A 9-year-old boy near 4'4" and 63 lbs sits around the 50th percentile — middle of the pack, not a finish line.
A 5-year-old girl near 3'6" and 39 lbs also tracks the 50th, yet both children can be healthy well outside that exact mark.
How do I read a kids' growth chart?
Locate age along the bottom axis, trace upward to the plotted point, and note which curve it touches. The slope across visits matters more than where a single dot lands on any one afternoon.
Is BMI for kids interpreted the same as adult BMI?
No. Pediatric readings use BMI-for-age, adjusted for sex and growth stage. A BMI of 22 in a 15-year-old boy is read on a percentile curve, not against the adult 18.5–24.9 cutoff. CDC's own teaching example makes this plain: a 12-year-old girl at 5 feet and 136 lbs has a BMI near 26.6, placing her at the 96th percentile — an obesity-range reading that would sit in the "normal" band on an adult table.
Should I worry if my child sits below the 50th percentile?
Usually not. Many healthy children hold steady at the 10th or 20th percentile simply from family frame. The signal worth attention is a falling line over time or measurements holding below the 5th, not a static low number.
What's the difference between CDC and WHO growth charts?
WHO covers birth through age 2 using breastfed infants as the reference population. CDC covers ages 2 through 20 and reflects U.S. survey data. The handoff happens right around the second birthday in most practices.
Sources
This article is for informational and educational purposes only. It does not constitute medical advice or replace professional health assessment. Always consult a qualified healthcare provider regarding your child's individual health and nutrition goals. Individual results will vary.
Related Articles
6-Year-Old Boy Height and Weight: CDC Percentiles, Normal Ranges, and What to Track
Average Height and Weight for a 9-Year-Old Boy: Percentiles and Growth Trends
Height and Weight by Age: A Complete Guide to Normal Changes Across the Lifespan
Last updated: October 21, 2026. All growth-chart guidance reflects the CDC 2000 reference set and WHO pediatric standards as maintained by our expert editorial team.