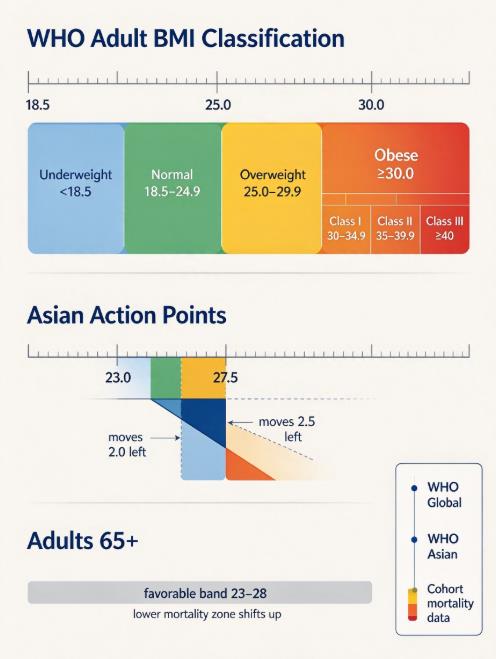
The short answer: WHO classifies adults by BMI cutoffs — underweight below 18.5, normal 18.5–24.9, overweight at 25 or above, and obesity at 30 or above. Those four numbers come from the World Health Organization and have been the global reference since the 1990s. Obesity splits into three classes: Class I at 30–34.9, Class II at 35–39.9, Class III at 40 or higher. The table looks simple. Using it on a real person is another matter.
We get emails every week from readers who run their numbers and land somewhere unexpected. A lifter at 27. A 70-year-old at 19. A 5'4" woman at 25.5 who runs three times a week. The cutoff did its job. The label just did not fit the body.
What the WHO Adult Classification Actually Says
BMI is weight in kilograms divided by height in meters squared. The WHO reference table sets five adult bands: below 17.0 as moderate or severe thinness, below 18.5 as underweight, 18.5–24.9 as normal weight, 25.0 and above as overweight, and 30.0 and above as obesity. The thresholds apply to both genders and do not change with age in adults, per WHO's nutrition monitoring guidance.
That same guidance is candid about what the numbers cannot do. BMI may not reflect the same degree of fatness across populations, partly because body proportions differ. Health risk rises continuously with BMI rather than jumping on or off at a cutoff. A person at 24.9 and a person at 25.0 sit on either side of a line. Neither sits on the edge of a cliff.
Obesity itself gets a second layer of detail. Class I covers 30 to 34.9, Class II runs 35 to 39.9, and Class III starts at 40. That grading shows up in clinical settings because risk climbs with each step, even though the underlying screening tool stays the same.
Where the Global Standard Diverges From Local Guidance
WHO's 25 and 30 lines are a global baseline, not a universal verdict. Asian populations develop visceral fat and related metabolic risk at lower BMI values, and WHO has recommended lower public health action points of 23 for overweight and 27.5 for obesity in many Asian groups. A 5'6" Asian adult at BMI 24.5 reads “normal” on the standard table and “overweight” under the adjusted frame.
Older adults tell a similar story from the other direction. The BMI linked to the lowest mortality in cohorts aged 65 and older tends to sit above the standard 18.5–24.9 window, and several analyses place the favorable band closer to 23–28. The same 22 that reads reassuring at 30 can read thin at 75.
| Frame | Overweight starts | Obesity starts | Applies to |
|---|---|---|---|
| WHO global standard | 25.0 | 30.0 | General adult populations |
| WHO Asian action points | 23.0 | 27.5 | Many Asian populations |
| CDC adult categories (US) | 25.0 | 30.0 | US adults 20+ |
Those two adjusted frames run alongside the main WHO table. They do not replace it. They mark where a single global cutoff stops being the whole answer. If you are comparing yourself against the standard bands, an asian bmi calculator can show where the adjusted lines fall. A body fat calculator adds the tissue-level reading the quotient cannot provide.
How to Read Your Own Number Against the WHO Bands
Start with the raw quotient. Enter height and weight into a Metric/Imperial BMI Calculator and note which band you land in. That is the WHO classification applied to you, with no editorial layer.
Then add context before you accept the label. Waist circumference is a quick second data point — risk rises at 35 inches for women and 40 inches for men. Body composition matters too. A 200 lb lifter and a 200 lb sedentary adult can share a BMI of 27 and carry completely different amounts of fat.
One reader note stuck with us: a 61-year-old wrote that her BMI had read 24.8 for years, then crossed 25.0 after a winter of reduced activity. Nothing dramatic changed. The label flipped anyway. She mentioned, almost as an afterthought, that the tape measure she'd been using was five years old and the markings had worn faint. Her waist had barely moved. The boundary did exactly what it was designed to do — flag a line, not deliver a clinical call.
We also see the opposite mismatch regularly. One site visitor with competitive athletic muscle mass registered a BMI of 26.1, landing in the overweight category, while their waist circumference stayed well within healthy population benchmarks. A rounding difference of 0.1–0.2 from one tool to another can flip a borderline reading across a category line.
That lag matters more than the math.
Use the WHO bands as a first screen. Bring waist, body fat, and trend to the conversation before you treat a label as a conclusion. And before you recalculate, check the tape you're using — the markings, the placement, whether you're measuring the same spot twice.
Frequently Asked Questions
What are the official WHO BMI categories for adults?
Underweight is below 18.5, normal weight is 18.5–24.9, overweight is 25.0 and above, and obesity is 30.0 and above. WHO also flags below 17.0 as moderate or severe thinness. Obesity is further split into Class I (30–34.9), Class II (35–39.9), and Class III (40 or higher).
Does WHO use the same BMI cutoffs for everyone?
The baseline table applies to both genders and all adult ages. WHO has separately recommended lower public health action points for many Asian populations — 23 for overweight and 27.5 for obesity — because metabolic risk appears at lower BMI values in those groups. The global table is the starting point, not the final word for every population.
What does WHO say about BMI's limitations?
WHO's own guidance notes that BMI may not correspond to the same degree of fatness across populations and that risk rises continuously rather than switching on at a cutoff. The practical implications:
A cutoff flags a boundary. It does not classify an individual's health.
Waist circumference and body composition add information BMI cannot carry.
Population-level cutoffs may need adjustment for ethnicity and age.
Athletes and older adults are common cases of mismatch between BMI and body reality.
Is the WHO classification the same as what the CDC uses?
For adults, yes on the core thresholds: underweight below 18.5, normal 18.5–24.9, overweight 25.0–29.9, obesity 30.0 and above. No daylight between the two tables at those lines.
How old is the WHO BMI classification?
The BMI-based framework was promoted by WHO in the 1990s and built on actuarial tables from the 1950s. It became the de facto global standard for research, screening, and public health monitoring. The cutoffs have been revisited and supplemented over time, but the core 18.5 / 25 / 30 lines remain the reference most health systems use today.
Sources
WHO Nutrition Landscape Information System: BMI Classification and Cutoffs
Health Promotion Board (Singapore): WHO Asian BMI Action Points — 23 and 27.5
This article is for informational and educational purposes only. It does not constitute medical advice, diagnosis, or treatment. Always consult a qualified healthcare provider regarding your individual health and weight-related goals. Individual results will vary. The BMI Calculator Blog Team maintains editorial independence and does not sell health products.