For Asian women over 50, “healthy BMI” sits between two opposing pulls: the Asian threshold moves the ceiling down to 23, while age moves the optimal range up toward the mid-20s. A reader note from last spring captured the confusion exactly — a 54-year-old Chinese woman had read “under 23” for years, then a screening note mentioned 26 as reasonable for her age, and she asked which one was wrong. Neither. The Asian cutoffs apply. So does the age curve. What changes is where you draw the line for a specific body at a specific stage.
What the Asian BMI Classification Sets
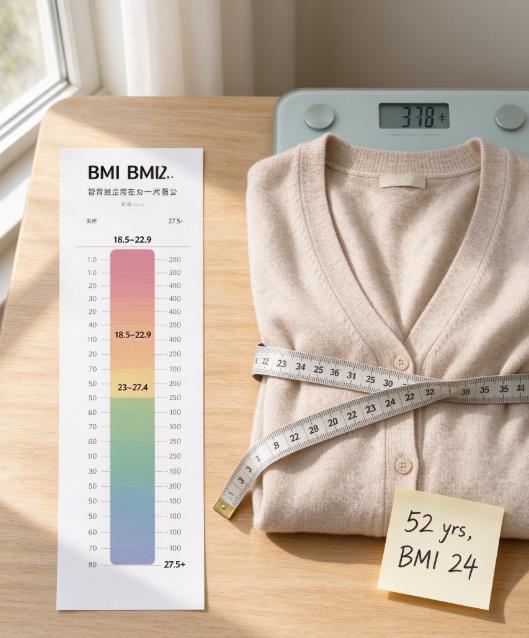
The standard WHO table puts normal weight at 18.5–24.9. For Asian populations, the 2004 WHO expert consultation identified lower public health action points: 23.0 for increased risk and 27.5 for high risk, with normal weight running 18.5–22.9. The consultation was candid about why: Asian populations show different associations between BMI, body fat percentage, and health risk than European populations, and the proportion at high risk of type 2 diabetes and cardiovascular disease is substantial at BMIs below the standard overweight line of 25.
Those numbers were not pulled from thin air. Visceral fat — the metabolically active fat around organs — tends to accumulate at a lower BMI in Asian adults, and postmenopausal Asian women show a higher ratio of visceral to subcutaneous fat than Caucasian women of the same age and BMI. The ceiling drops because the risk curve shifts left.
So a BMI of 24.0 that reads comfortably “normal” on the global table sits inside the increased-risk band under the Asian frame.
Where Age Pulls the Range the Other Way
Mortality data tell a different story after 50. A cohort study of 12.8 million Korean adults found the BMI linked to lowest all-cause mortality shifted upward with age for women: 21.0–26.9 at ages 45–54, then 24.0–28.9 at ages 65–74. The study’s overall conclusion put the sex-age-specific optimums generally higher than the standard 18.5–24.9 window, except in women under 50.
The two data sets don’t argue. They just answer different questions. The range that carries the least mortality risk after 50 sits higher than the Asian normal-weight ceiling of 22.9. The Korean data put the favorable band for women 45–54 at roughly 21 to 27, straddling both the Asian overweight line of 23 and the standard overweight line of 25.
| Reference frame | Normal / low-risk range | Where 23.0 falls |
|---|---|---|
| WHO global adult | 18.5–24.9 | inside normal |
| WHO Asian action points | 18.5–22.9 | overweight (23.0–27.4) |
| Korean women, ages 45–54 | 21.0–26.9 (lowest mortality) | inside optimal band |
| Korean women, ages 65–74 | 24.0–28.9 (lowest mortality) | below optimal band |
That table is the whole tension in four rows. 23.0 is overweight under the Asian frame and mid-optimal under the age-specific mortality frame for the same demographic. Neither is wrong. They answer different questions — risk of metabolic disease versus risk of death from all causes. BMI screening is a population-level reference, not a rigid pass/fail marker for one body on one morning.
How to Read Your Own Number at 50-Plus
Start with the Asian frame. An Asian BMI Calculator places your number against the 23 and 27.5 lines rather than the global 25 and 30. That gives you the metabolic-risk reading, which is the one that matters for diabetes and cardiovascular screening.
Then layer the age curve on top. A Senior BMI Calculator shows where the same number sits against age-adjusted bands. If you are 52 and your BMI is 24, the Asian frame flags mild elevation while the age-specific mortality data suggest you are still within a low-risk zone. If you are 72 at the same BMI, the picture shifts again — the Korean data put the favorable band starting at 24.0 for women 65–74, so 24.0 sits at the lower edge rather than the middle.
Waist circumference settles more arguments than either table. For Asian women, the recommended threshold is 80 cm (about 31.5 inches), lower than the 88 cm cutoff used for Caucasian women. A woman at BMI 22.5 with a waist of 82 cm is lean by the quotient and central-obese by the tape. That mismatch is common in postmenopausal Asian women, and it is why the BMI number alone rarely tells the full story after 50.
We have seen this pattern repeatedly in reader emails. The women who feel best at 55 and 60 are rarely chasing the lowest possible BMI. They track waist, strength, and how clothes fit across seasons — and use an Adult BMI Calculator as a starting point, not a verdict, before layering in waist and age context.
Frequently Asked Questions
Is BMI 23 healthy for an Asian woman over 50?
It depends on which frame you apply. Under the WHO Asian action points, 23.0 is the first notch into the overweight band. Under the age-specific mortality data from the Korean cohort, 23.0 sits comfortably inside the favorable range for women in their 50s. A waist measurement below 80 cm and stable weight across seasons push the reading toward the lower-risk interpretation.
Should Asian women over 50 aim below 23 or above it?
A strict “below 23” target is not supported by the mortality data for this age group. The Korean cohort put the lowest-mortality range at 21.0–26.9 for women 45–54 and 24.0–28.9 for women 65–74. Staying under 23 at 70 may be lower than the range linked to best outcomes. The practical target is usually the low-to-mid 20s, combined with a waist under 80 cm.
What measurements pair with BMI after 50?
BMI is one input. The others that carry weight for Asian women in this age band:
Waist circumference: under 80 cm (about 31.5 inches) for Asian women.
Weight trend: stable across 6–12 months beats a single low reading.
Grip strength or resistance-training consistency.
Waist-to-height ratio: keep waist under half your height.
Why does the Asian cutoff matter more after menopause?
Menopause shifts fat toward the abdomen, and Asian women tend to store more visceral fat at a given BMI than Caucasian women. A postmenopausal woman can hold a BMI of 22 and still carry enough visceral fat to raise metabolic risk. The lower Asian cutoff exists because that pattern shows up at BMIs that would read “normal” on the global table.
Does the standard “under 25” rule still apply?
For Asian women, 25 is already inside the overweight band under the WHO Asian action points. The global 25 line was built on European-ancestry populations and does not carry the same meaning for this group. The relevant upper bound for metabolic risk is 23, adjusted upward only by the age-specific mortality data — not by switching back to the global table.
Sources
This article is for informational and educational purposes only. It does not constitute medical advice, diagnosis, or treatment. Always consult a qualified healthcare provider regarding your individual health and weight-related goals. Individual results will vary. The BMI Calculator Blog Team maintains editorial independence and does not sell health products.