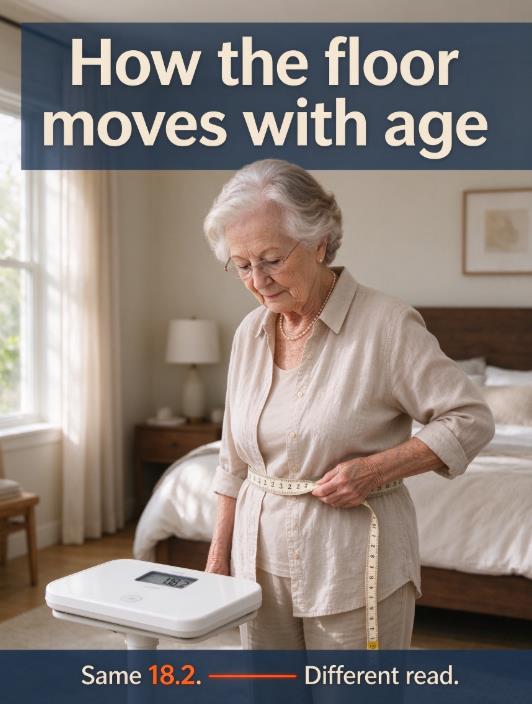
BMI 18.2 in a woman over 65 sits below the standard underweight line of 18.5, and the risk attached to that number climbs with age. Generic charts call it “mild thinness.” Geriatric mortality and fracture data tell a less casual story. The floor moves after 65 — even if the chart stays still.
We kept tripping over that gap while editing reader mail last winter. A number that reads borderline on one screen reads late-stage on another. The difference is not cosmetic.
What BMI 18.2 Means by the Numbers
Run the formula: kilograms divided by height in meters squared. An 18.2 lands inside the 17.0–18.5 band that the CDC labels underweight for all adults 20 and older, with no age or sex adjustment baked in. That uniformity keeps population snapshots simple. It does not map cleanly onto a 72-year-old body that has already lost lean mass through menopause and the decade that followed.
Age-specific mortality curves bend differently. Pooled analyses of older adults consistently show the BMI linked to the lowest death rate sitting higher than the standard 18.5–24.9 window — often drifting into the mid-20s or above. For a woman in her 70s, 18.2 is not a borderline reading. It sits several points below where the data say risk starts climbing.
Why the Same Number Reads Differently After 65
Muscle loss changes what the quotient represents. Women lose lean mass steadily across the menopause transition, and the slide continues past 65. Weight can hold steady while the tissue underneath shifts toward fat and away from the contractile tissue that keeps a person upright and stable.
A BMI of 18.2 usually means low reserves in both compartments. Less muscle means less strength and slower reactions. Less fat means a thinner buffer when appetite drops or a respiratory bug turns into two weeks of poor intake. The number itself does not say which of those two is driving the reading — but at 18.2, both are usually in play.
Fracture data point the same direction. NIH bone health reviews note that older women below roughly 127 pounds carry about a twofold higher hip fracture risk compared with heavier peers, and the increased risk traces largely to lower hip bone density. Weight loss later in life adds its own layer, with roughly double the subsequent hip fracture risk regardless of current weight. Bone responds to physical load. Less weight means reduced force on the skeleton, and bone density often drops along with that reduced load.
One reader detail still sticks with the desk. A 74-year-old wrote that her trousers fit the same through summer, then went loose by Thanksgiving. The scale had moved a pound and a half. The tape had already shifted two inches. That gap between scale numbers and real body changes is exactly why one decimal point, taken on a random Tuesday morning, never tells the whole story.
What to Check Alongside the Decimal
A number on a chart is a prompt, not a verdict. For an older woman at 18.2, the next step is context — not a blanket calorie surplus from whatever happens to be in the pantry. Here are the signals that carry more weight than the decimal itself:
Trajectory: unintentional loss past 5% in six months carries more signal than today’s absolute BMI.
Function: grip strength and walking pace track muscle status better than the quotient alone.
Intake pattern: appetite dips usually show up weeks before the scale admits anything.
Before refreshing anything on an Adult BMI Calculator, pull out a tape measure. Federal screening still draws the waist line at 35 inches for women regardless of what the BMI number says. Then run the same inputs through a Senior BMI Calculator so the display uses 65-plus bands rather than the young-adult table. A follow-up healthy weight range check shows where current weight sits next to a functional target, not a generic statistical midpoint.
Frequently Asked Questions
Is BMI 18.2 automatically risky for every woman over 70?
Not uniformly. A lifelong petite frame with stable weight across two years reads differently from a recent drift downward from 22. Stability across seasons matters more than the decimal on one morning. But for an older woman with unintentional loss, 18.2 is a flag worth acting on rather than watching.
Why does the risk zone shift upward with age?
Mortality data in older cohorts show the lowest death rates clustering at higher BMI values than the standard table suggests. A cutoff calibrated on 30-year-olds does not map onto a 75-year-old body that has already lost lean mass and bone density. The number means something different because the body composition underneath it has changed.
What should a home screening track besides the BMI number?
Weight is one input. The quieter signals tend to be more useful:
Monthly waist change, not weekly scale hops.
Grip strength or whether a usual walk now needs a pause.
Protein intake at meals and whether appetite held through the winter.
Any fall, near-fall, or new hesitation on stairs.
Can adding muscle change the read without moving weight much?
Yes. Lean tissue rebuilds without a large scale shift because muscle is dense. The number can stay pinned near 18 while function improves. That is one more reason the quotient alone tells an incomplete story for this age group.
When does a healthcare conversation make sense at this number?
Any unintended drop crossing 5% in six months, paired with weaker grip or a stumble, is enough reason to bring the trend to a qualified healthcare provider. Not an emergency scramble — just not something to shrug past either. Individual circumstances vary, and a provider can separate stable thinness from a drift that needs attention.
Sources
This article is for informational and educational purposes only. It does not constitute medical advice, diagnosis, or treatment. Always consult a qualified healthcare provider regarding your individual health and nutrition goals. Individual results will vary. The BMI Calculator Blog Team maintains editorial independence and does not sell health products.