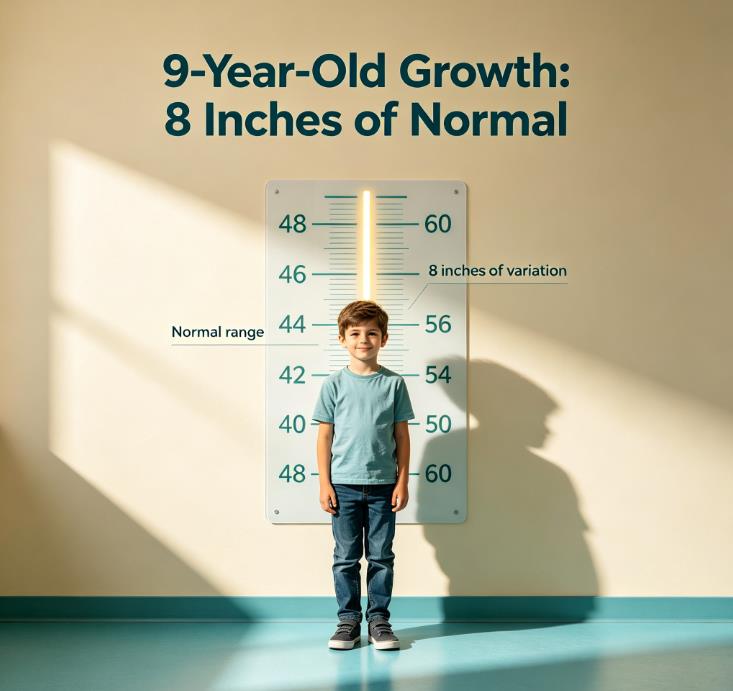
Most 9-year-old boys in the U.S. stand somewhere between 48 and 57 inches, and somewhere between 46 and 88 pounds. The CDC 50th percentile sits near 52.4 inches (133 cm) and 63 pounds (28.6 kg) — but “average” is a midpoint on a curve, not a pass/fail mark. Healthy weight for children is BMI-for-age from the 5th to below the 85th percentile, not a fixed pound target.
What “Average” Actually Means
Average is the 50th percentile on CDC growth charts — the middle point. Half of 9-year-old boys are taller and heavier; half are smaller. A boy at the 10th percentile may simply carry a smaller family frame, and a boy at the 80th may have a larger one. One reading doesn’t say much without the rest of the curve.
BMI cannot separate muscle from fat, so an athletic boy can land in a higher percentile while being perfectly fit. A pediatric BMI lookup places a specific height and weight against the CDC curve by exact age and sex.
Height and Weight Percentiles at Age 9
| Percentile | Height | Weight |
|---|---|---|
| 5th | ~48.3 in (123 cm) | ~49 lb (22.2 kg) |
| 50th | ~52.4 in (133 cm) | ~63 lb (28.6 kg) |
| 95th | ~56 in (142 cm) | ~88 lb (40 kg) |
Approximate values from CDC 2000 boys’ growth charts. A boy at 4 feet and one at 4 feet 8 inches can both be healthy when their own curves track steadily.
BMI Percentiles: The Kid-Specific Metric
Kids do not use adult BMI cutoffs. BMI is compared to other boys the same age. CDC categories run from underweight below the 5th percentile, healthy weight 5th to below the 85th, overweight 85th to below the 95th, to obesity at or above the 95th. Severe obesity starts at 120% of the 95th percentile or a BMI of 35 kg/m², whichever is lower.
CDC’s own training example makes this concrete: a 9-year-old boy with a BMI of 15.2 lands at the 28th percentile — solidly healthy. Athletic kids often show higher BMI percentiles from muscle density alone, not excess fat.
AAP and Bright Futures recommend BMI screening at least annually for children 2 and older. Year-over-year tracking matters more than a single visit. A pediatric BMI percentile guide logs past measurements so you can bring a clear history to a pediatrician.
Why Growth Is Not a Straight Line
Puberty timing varies widely — most boys start between 9 and 14. Spurts can push height first and dip BMI, or pad weight first and bump BMI; both are ordinary. Genetics sets much of the frame. What matters is staying on the child’s own curve rather than comparing to classmates on a single afternoon.
We also hear from parents who compare their son to teammates on the soccer field, which almost always leads to unnecessary worry. One quiet pattern we keep seeing in parent logs: parents who weigh their child every week after school end up worrying over tiny swings that mean nothing. Hallway height marks taken with socks on distort more readings than any real growth slowdown. Bare feet, same wall, same scale — those three conditions remove most of the noise.
When a Trend Deserves a Provider Conversation
Per CDC and AAP guidance, these patterns are worth raising at the next visit: crossing two or more major percentile lines (dropping from the 75th to the 25th in height, or jumping from the 50th to the 90th in weight); BMI at or above the 95th or below the 5th percentile; or no height gain for 6–12 months.
Growth charts are screening tools. A pediatrician reads sleep, diet, activity, and family history alongside the numbers. All percentile cutoffs here follow the CDC 2000 reference set used in pediatric training.
Frequently Asked Questions
What is the average height for a 9-year-old boy?
About 52.4 inches (133 cm) at the CDC 50th percentile. Most boys fall between roughly 48 and 57 inches. A boy at the 10th or 90th percentile can still be growing normally when his own curve holds steady.
What is the average weight for a 9-year-old boy?
About 63 pounds (28.6 kg) at the 50th percentile. Healthy weight depends on BMI-for-age percentile, not pounds alone. A muscular boy can weigh more than 63 pounds while staying in the healthy band, and a shorter boy can weigh less without being underweight.
How do I know if he is overweight?
Use his BMI-for-age percentile, not the raw BMI number. CDC defines overweight as the 85th to below the 95th percentile, and obesity at or above the 95th. A provider can confirm whether a higher percentile reflects muscle, fat, or a growth spurt, especially if he is athletic.
How often should his growth be checked?
AAP and Bright Futures recommend BMI screening at least annually for children 2 and older, typically at well-child visits. The trend across visits carries more signal than any single reading. Weekly home measurements mostly create noise. Once-a-year tracking alongside routine checkups gives clear growth data for nearly all kids.
Stable percentile: a boy holding steady at the 80th percentile for years follows a normal path.
Sharp jump or drop: a rise from the 50th to the 90th, or a fall from the 75th to the 25th within six months, is worth raising at the next visit.
Sources
This article is for informational and educational purposes only. It does not constitute medical advice or replace professional health assessment. Always consult a qualified healthcare provider regarding your child’s growth and nutrition goals. Individual results will vary. The BMI Calculator Blog Team maintains editorial independence and does not sell health products.
Related Articles
Height and Weight for Kids: CDC Percentiles & Growth Charts (Ages 2–20)
8-Year-Old Height and Weight: CDC Ranges, Growth Tracking, and When to See a Pediatrician
BMI for Children 2-19: CDC Growth Charts, 5 Categories, and Tracking
Last updated: October 21, 2026.