Quick Summary: BMI for children 2–19 differs from adult BMI. CDC growth charts use BMI-for-age percentiles to compare kids to same-age, same-sex peers. Categories span underweight (below 5th percentile) to severe obesity (120% of the 95th percentile). Learn to read these charts and focus on long-term growth trends.
BMI for kids aged 2–19 uses BMI-for-age percentiles, not the fixed 18.5–24.9 adult ranges.
The four main categories: underweight below the 5th, healthy weight 5th–84th, overweight 85th–94th, obese 95th and above.
Severe obesity starts at or above 120% of the 95th percentile (or a BMI of 35 kg/m² or higher).
Track the trend over time — one reading matters far less than the pattern across months and years.
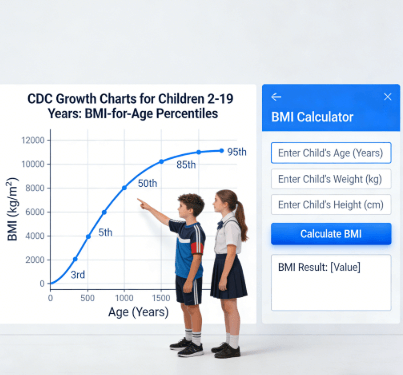
Why BMI for Children 2–19 Uses Percentiles, Not Fixed Ranges
Adult BMI uses fixed numbers—18.5 to 24.9 is healthy, 30 and above is obese. Kids don't work that way. Their bodies change constantly through growth, puberty, and shifts in body composition, so a single number can't tell you whether a child is growing well.
The CDC solved this with BMI-for-age percentiles. A percentile compares your child's BMI to other children of the exact same age and sex. That context is what makes the number meaningful.
A BMI of 18 might be perfectly healthy for a 15-year-old but would land in the overweight row for a 7-year-old. Percentiles capture that difference, which is why they're the standard from age 2 through 19. Parents can skip manual chart lookups with a CDC child BMI calculator built on the CDC method.
For teens 13 to 19, raw BMI starts to look more like adult numbers, but the CDC still recommends percentiles—puberty and growth spurts move the curve. We hear from parents weekly who see a percentile jump during a growth spurt and assume something is wrong. Often it isn't; the height curve tells the rest of the story.
Note: CDC BMI-for-age percentiles apply to children 2–19 years old. Children under age 2 rely on WHO weight-for-length growth standards instead, so this chart isn't the right tool for infants and toddlers.
What Are the CDC BMI Percentile Categories for Ages 2–19?
The table below follows CDC BMI-for-age screening standards for children and teens 2–19. These bands apply to all kids from age 2 through 19:
| BMI-for-Age Percentile | Category | What It Means |
|---|---|---|
| Below the 5th | Underweight | May signal slow growth; worth a check-in with a healthcare provider. |
| 5th – 84th | Healthy weight | Weight is proportionate to height; keep consistent habits. |
| 85th – 94th | Overweight | Elevated risk zone; more activity and fewer sugary drinks usually come first. |
| 95th and above | Obese | Higher chronic risk; needs a provider-guided plan that protects growth. |
| At or above 120% of the 95th (or BMI 35+) | Severe obesity | Highest-risk band; closer medical follow-up. |
A child at the 60th percentile isn't healthier than one at the 25th — both are growing fine. Percentiles aren't test scores. The pattern over time is what matters, not one visit.
The American Academy of Pediatrics 2023 guideline reinforces these bands and notes children are unlikely to outgrow obesity without support, which is why early, non-judgmental screening matters. Per that guideline, severe obesity is split further:
Class 2 obesity: 120–140% of the 95th percentile, or BMI 35–39.9 kg/m².
Class 3 obesity: ≥140% of the 95th percentile, or BMI ≥40 kg/m².
Both fall under pediatric specialist follow-up. For tracking above the 97th percentile, the CDC offers extended BMI-for-age growth charts.
How to Calculate and Track BMI for Children 2–19 Years
The formula is the same as adult BMI—metric is weight in kg ÷ height in meters squared; imperial is (lb ÷ in²) × 703. A body mass index calculator handles the arithmetic, but interpretation is where it gets tricky, especially across visits.
One measurement tells you very little. Most parents fixate on a single number, when the trend across months is what counts. A child's percentile should stay fairly steady as they grow. A jump from the 60th to the 85th in six months, or a drop from the 50th to the 10th, is worth discussing with a healthcare provider.
At home, logging every week creates noise. A BMI percentile tracker is more useful when readings line up with routine well-child visits—typically annually, per AAP-aligned schedules, though some providers screen more often in early childhood. The exact interval isn't a CDC rule; ask your child's doctor what fits.
BMI also isn't perfect for every child. Muscular kids—young athletes especially—can land in the overweight row from muscle, not fat. In those cases BMI should sit alongside other assessments, not alone.
Practical Tips for Accurate Home Measurements
Weigh at the same time. First thing in the morning, after the bathroom and before food, gives the steadiest read.
Measure height against a flat wall. Barefoot, heels and back touching the wall, a book flat on the head, mark at the bottom edge.
Use the same scale each time. Same wall, same scale—changes reflect growth, not scale or measurement differences.
Talking to Your Child About BMI in a Healthy Way
How parents talk about weight shapes body image for years. Frame it around energy, strength, and how the body feels—not the number on the chart. If habits need to shift, make it family-wide: more walks, more vegetables for everyone, not one child singled out.
One parent wrote in last year: her son's percentile jumped from the 62nd to the 88th in a year, and she was ready to restrict meals. His provider looked at the height curve—he'd grown several inches in that span. No intervention, just reassurance. That's the trend-vs-snapshot point in real life.
Key Tips for Using CDC BMI Growth Charts
The charts are a screening tool — they flag patterns worth a closer look, but they don't label kids. Their value is in guiding habits, not sorting children.
No strict calorie cuts without supervision. Rapid loss can disrupt growth. Aim for weight maintenance while height catches up.
Growth spurts shift the line. Pre-teens often gain height first; BMI percentile dips temporarily, then settles.
Habits over numbers. About 60 minutes of daily activity, less screen time, balanced meals.
Ask a provider on fast crossings. Below the 5th, above the 85th, or a quick jump between bands is worth a visit.
Bring the full growth pattern to the visit, not just the latest number. That is the frame providers can actually work from with you.
Tracking the Trend, Not the Snapshot
BMI for kids is about growth in context. The CDC charts stay the standard because they keep children off adult cutoffs and give a comparable line against same-age peers. Use a calculator for the snapshot, use the chart for the trend.
Frequently Asked Questions
Why are percentiles used instead of fixed BMI numbers for children?
Children grow constantly, and body composition shifts with age and puberty. A fixed cutoff can't account for that. Percentiles compare a child's BMI to peers of the same age and sex, which is why a BMI of 18 can be healthy for a 15-year-old but not for a 7-year-old.
At what age should BMI tracking start with CDC charts?
CDC recommends BMI-for-age percentiles from age 2 through 19. Under age 2, use WHO weight-for-length standards instead. Starting at 2 lets tracking run consistently through adolescence.
What if my child's percentile crosses several lines?
A fast move up or down is worth a conversation with your child's doctor. It may be a growth spurt, a change in routine, or something to evaluate—the provider can tell which. One off reading rarely decides it; the crossing pattern does.
Can a muscular child read as overweight on BMI percentiles?
Yes. BMI does not separate muscle from fat, so active kids in sports may sit in the overweight band from lean mass alone.
What counts as severe obesity on the CDC chart?
Severe obesity is at or above 120% of the 95th percentile, or BMI 35 kg/m² or greater—whichever comes first. The AAP 2023 guideline splits it further:
Class 2: 120–140% of the 95th percentile, or BMI 35–39.9 kg/m².
Class 3: ≥140% of the 95th percentile, or BMI ≥40 kg/m².
Both are pediatric specialist territory, not home-label territory.
Sources
CDC: Child and Teen BMI Categories — BMI-for-Age as a Screening Measure
AAP: Clinical Practice Guideline for Children and Adolescents With Obesity (2023)
WHO: Child Growth Standards — Weight-for-Length Under 2 Years
This article is for informational and educational purposes only. It does not constitute medical advice or replace professional health assessment. Always consult a qualified healthcare provider regarding your child's growth or weight-related questions.
Related Articles
Child BMI Calculator: How to Read Percentiles, Muscle & Age (Not Just the Number)
Height and Weight for Kids: How CDC Growth Charts & Percentiles Work (Ages 2–20)
How to Use the CDC BMI Calculator for Teens (And Read Percentiles)
Last updated: October 20, 2026. Reviewed against current CDC and WHO pediatric BMI guidance.