When a parent runs a child BMI calculator, the output that matters is not the BMI number — it is the percentile. A BMI of 18 can sit at the 50th percentile for a 15-year-old and above the 95th for a 7-year-old. Same number, different category. The percentile compares a child to peers of the exact same age and sex, which is why CDC uses percentile bands instead of adult cutoffs for ages 2 through 19.
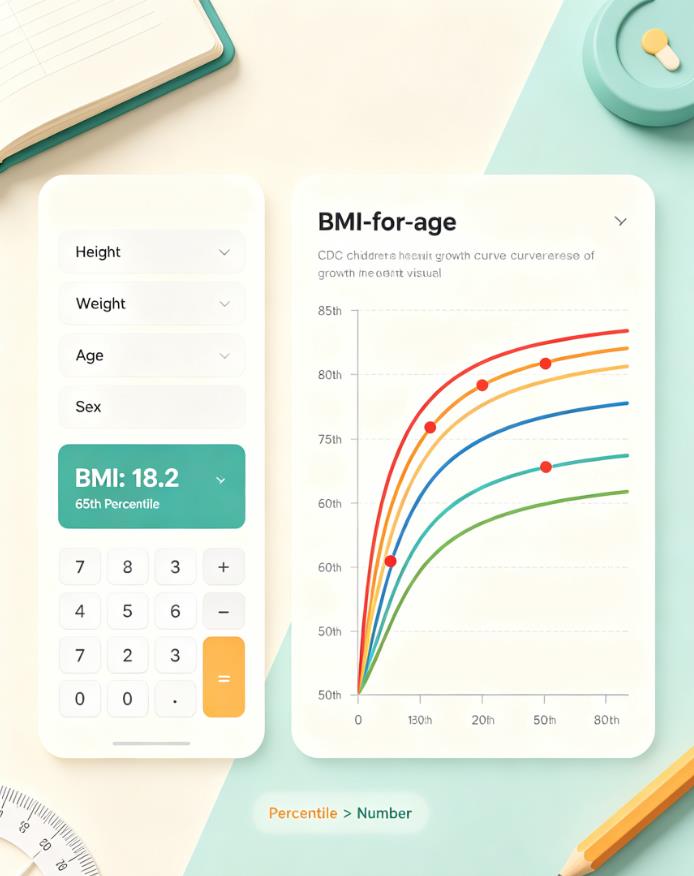
What the percentile actually means
A percentile is a ranking, not a grade. A child at the 60th percentile has a higher BMI than 60% of same-age, same-sex peers, and lower than the other 40%. That ranking says where a child falls in the lineup. It does not say whether the child is healthy. CDC’s BMI-for-age calculation does not include race or ethnicity; those metabolic risk differences are assessed separately, not built into the percentile.
| Percentile | CDC category |
|---|---|
| Below 5th | Underweight |
| 5th to under 85th | Healthy weight |
| 85th to under 95th | Overweight |
| 95th or above | Obesity |
| 120% of 95th or BMI ≥35 | Severe obesity |
AAP splits severe obesity further: Class 2 is 120% to under 140% of the 95th percentile, or BMI 35 to under 40; Class 3 is 140% or above, or BMI 40 or above. Both fall under pediatric specialist follow-up rather than home labeling.
A single high reading often causes alarm. But if the percentile has held steady for years, the reading may reflect a growth spurt or a measurement error. A child BMI calculator applies the age- and sex-specific percentile automatically — but it is only as good as the height and weight you feed it.
Why muscle fools the calculator
BMI reads only height and weight. It has no way to tell lean mass from fat mass. Where that fat sits — around the waist or elsewhere — is invisible to the formula. A young athlete in football or swimming can land in the 90th percentile with very low body fat. So the number on the screen says one thing while the kid’s actual build tells a different story.
CDC frames BMI-for-age as a screening measure. It does not stand in for a professional assessment. A child at the 95th percentile with low body fat and a stable growth curve is not in the same situation as a child at the 95th percentile with rising waist circumference. The percentile flags a pattern for you to check. Body composition details help you sort out what it means.
A kids BMI percentile tracker lets you log measurements across visits and see the direction rather than a single morning. If you are also tracking your own weight, keep the adult and pediatric frames separate — a body mass index calculator for adults uses fixed bands that do not apply to a growing child.
How to measure accurately
Small measurement errors can shift a percentile, especially for shorter children where the reference curves are steep. A 2 cm error in height is enough to move the percentile by a visible margin in borderline cases, though the exact shift depends on the child’s age and starting percentile.
We have looked at a lot of parent-submitted height photos, and the most common slip is heels not touching the wall. Measure height against a flat wall, no shoes, heels together, a book flat on the head, mark at the bottom edge. Weigh on a digital scale on a hard floor, in light clothes, at the same time of day. Enter age in months, not just years — a 10-year-old and a 10.9-year-old sit on different curves. Use sex assigned at birth; CDC charts are split by male and female growth patterns.
For tracking, CDC and the American Academy of Pediatrics recommend BMI screening at least annually for children 2 and older, typically at well-child visits. Checking every week creates noise. A rise or fall across two or more percentile lines over six to twelve months is the signal worth raising at the next visit.
Where BMI stops explaining
BMI misses visceral fat, and it does not adjust for ethnic differences in metabolic risk. Some Asian children show risk at lower percentiles, which is why WHO publishes a separate 5–19 growth reference using BMI-for-age Z-scores: overweight above +1 SD, obesity above +2 SD. For most U.S. families, CDC charts remain the standard for clinical and school screening.
Waist circumference adds a second signal. A child at the 70th percentile with a rising waistline may carry more risk than a child at the 90th percentile with a stable waist. If BMI is high but the waist is small, muscle is the more likely driver.
A mother wrote in last year: her son’s percentile climbed from the 62nd to the 88th in twelve months, and she was ready to cut portions. His provider looked at the height curve — he had grown several inches in the same stretch. No change was needed. The percentile had moved because the denominator moved.
All screening guidance in this write-up stays aligned with the editorial review process led by Dr. Sarah K. Johnson, PhD, RD, consistent with current CDC and AAP publications.
Frequently Asked Questions
What is the difference between a child and adult BMI calculator?
Adult calculators use fixed BMI bands — 18.5 to under 25 is healthy, 30 or above is obesity. Child calculators use age- and sex-specific BMI-for-age percentiles. A BMI of 18 can be healthy for a 15-year-old and overweight for a 7-year-old. Using an adult calculator for a child produces a misleading result.
Can a child be “overweight” on BMI and still be healthy?
Yes. BMI-for-age cannot separate muscle from fat. A young athlete can land in the 85th to 94th percentile from lean mass alone. The percentile flags a screening category, not a health outcome. Waist circumference and, where available, a body-composition estimate add the context the percentile cannot carry.
How often should a child’s BMI be checked?
CDC and AAP recommend BMI screening at least annually for children 2 and older, usually at well-child visits. The trend across visits carries more signal than any single reading:
Stable percentile: a child holding steady at the 80th percentile for years is on a different trajectory from one who crossed two major lines in six months.
Sharp jump or drop: a rise from the 60th to the 85th, or a fall from the 50th to the 10th, is worth raising at the next visit.
Growth spurt: pre-teens often gain height before weight, which temporarily dips the percentile without any change in habits.
Checking weekly creates noise. Annual or visit-aligned tracking is enough for most children.
Does BMI work for children under 2?
No. CDC BMI-for-age percentiles start at age 2. Children under 2 use WHO weight-for-length standards instead. Applying the BMI-for-age chart to an infant or toddler gives a number without a valid reference curve behind it.
What does it mean if a child’s percentile is dropping?
A slow, steady drop can be normal as a child grows taller. A rapid drop, or a drop below the 5th percentile, is worth a conversation with a healthcare provider — it may signal undernutrition, illness, or a measurement issue. One reading rarely settles it; the crossing pattern does.
Sources
This article is for informational and educational purposes only. It does not constitute medical advice or replace professional health assessment. Always consult a qualified healthcare provider regarding your child’s growth and weight-related goals. Individual results will vary. The BMI Calculator Blog Team maintains editorial independence and does not sell health products.
Related Articles
BMI for Children 2-19 Years: CDC Growth Charts, Percentile Ranges & Tracking Guide
How to Use the CDC BMI Calculator for Teens (And Read Percentiles)
Girls BMI Calculator: How to Read CDC Percentiles and Spot Normal Puberty Changes
Last updated: October 20, 2026.