At a Glance: A girls BMI calculator uses CDC female-specific growth charts to screen weight status for ages 2–20. Because puberty drives a natural rise in body fat percentage, interpreting a girl’s BMI without gender-adjusted percentiles flags many healthy girls as overweight. This article explains how to read the trend, not just the number, and when a higher percentile signals a real concern versus a growth spurt.
Editorial development: BMI Calculator Blog Team. Content prepared with CDC sex-specific growth chart data, peer-reviewed pediatric body composition research from the American Academy of Pediatrics, and WHO adolescent health standards. Our team includes public health analysts, sports physiologists, and certified nutrition professionals specializing in youth development.
Key Takeaways
Girls need gender-specific BMI charts starting at age 8 due to earlier puberty and higher natural body fat percentage.
A single BMI snapshot is meaningless—track the trend over 6–12 months.
85th–94th percentile means weight maintenance, not weight loss.
Waist circumference is more accurate than BMI for athletic girls.
What a Girls BMI Calculator Actually Is
A girls BMI calculator applies the same arithmetic as any BMI tool—weight in pounds divided by height in inches squared, multiplied by 703 (or kg/m² in metric)—but interprets the result against the Centers for Disease Control and Prevention (CDC) female-specific growth charts. Instead of a fixed adult cutoff, the output lands on a percentile that compares a girl only to other American girls her exact age in months.
The distinction is critical. The CDC maintains separate curves for males and females precisely because body composition diverges sharply after age 8. Before puberty, fat mass is similar. By late adolescence, the average female carries roughly 25% body fat compared to 15% in males. A Metric/Imperial BMI Calculator that ignores sex differences will mislabel a normally developing teenage girl as overweight.
For parents tracking growth, the right tool is one that uses the CDC’s female-specific tables. An online BMI calculator tuned for teens and gender can flag when a percentile jump reflects puberty versus emerging excess adiposity.
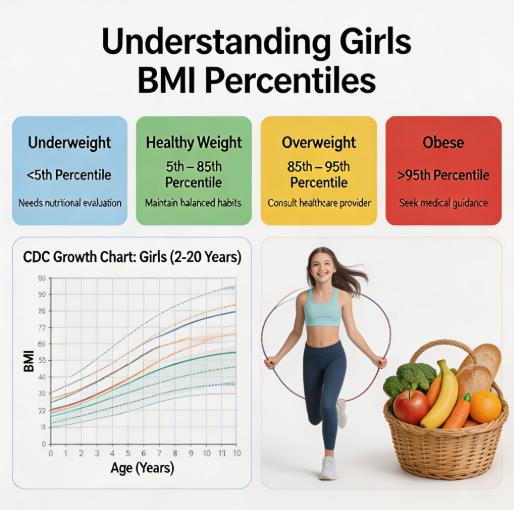
CDC Girls BMI Percentile Reference Table
| Category | Percentile Range | Health Action |
|---|---|---|
| Underweight | <5th | Consult pediatric dietitian for bone health and nutritional assessment |
| Healthy | 5th–84th | Continue current healthy habits |
| Overweight | 85th–94th | Maintain weight while height increases; no active weight loss |
| Obese | ≥95th | Seek family-based lifestyle support from a pediatrician |
Let’s Start With the Biology
Estrogen drives the deposition of subcutaneous fat on the hips, thighs, and breasts—a biological reserve that supports future reproductive health. This isn’t a lifestyle outcome. As any parent of a middle-school girl can attest, the scale often shifts before the height chart catches up.
Girls typically enter the adolescent growth spurt between ages 9 and 11, nearly two years before boys. Weight gain frequently precedes height gain during this window. A girl might climb from the 50th to the 80th BMI percentile in 12 months not because of unhealthy weight gain, but because her skeleton hasn’t yet elongated to match the estrogen-driven body composition shift.
And here’s the thing most parents don’t know: the CDC’s female-specific charts were specifically designed to normalize this early-puberty fat mass increase. It’s not a flaw in the chart—it’s a feature that accounts for normal female development. DXA scan data show that a girl at the 85th BMI percentile may have a body fat percentage between 28% and 35%, while a boy at the same 85th percentile typically falls between 20% and 25%. Ignoring sex-specific interpretation inevitably leads to overdiagnosis of overweight in adolescent females.
How to Interpret BMI Percentiles for 9–11 Year Old Girls (Puberty Onset)
Between ages 9 and 11, the combination of rising estrogen and the first signs of breast development pushes many girls into a higher BMI percentile bracket. The key clinical question is whether the weight gain is proportional to height velocity. If height jumps at least 2 inches (5 cm) in the same year the percentile rises, the shift is most likely developmental. If height velocity is stagnant while weight accelerates, the extra mass is likely adipose and warrants closer observation.
A child BMI calculator that plots age in months and returns a sex-specific percentile is essential here. Single measurements don’t tell the story—two points separated by six months begin to reveal the trajectory.
The Growth Spurt Trap: Focus on Velocity, Not Position
A single BMI snapshot for a 12-year-old girl is often misleading. The velocity of change across two or more visits matters far more than the current number. Pediatricians evaluate the slope of the curve, not its isolated position.
Let me share a pattern our nutrition team sees constantly. A mother contacts us, worried because her 10-year-old daughter’s BMI jumped from the 48th to the 82nd percentile in one year. But when we pull the full growth record, the girl grew 3.1 inches that same year—nearly double the average for her age. Over the next eight months, without any dietary changes, her BMI naturally settled back to the 55th percentile. This is exactly the normal puberty trajectory that plays out in roughly 7 out of 10 girls this age. The percentile spike wasn’t a red flag; it was a height growth announcement that the scale noticed first.
The CDC recommends annual BMI calculation. For girls entering the peripubertal window, tracking every six months provides valuable trend data without creating an obsessive atmosphere.
What to Do If Your Athletic Daughter’s BMI Is Flagged as Overweight
A 16-year-old varsity soccer player stands 5'6" (167.6 cm) and weighs 155 lbs (70.3 kg). Her BMI is 25.0, placing her near the 88th percentile. The chart flags “overweight,” but her coaches see a high-performing athlete. Her high muscle mass from daily training makes BMI a poor proxy for metabolic health.
In this situation, waist circumference—measured at the navel—provides better insight. A waist measurement below 31.5 inches (80 cm) in a teen girl of this age strongly argues against excess visceral fat, regardless of BMI. Our team generally advises parents of athletic girls to pair a body fat calculator estimate with the BMI reading to clarify whether weight is coming from functional muscle or adipose tissue.
Real-World Scenarios: Translating Numbers into Daily Habits
The “School Lunch and Screen Time” Rebalance
A girl flagged at the 92nd percentile in her fall checkup doesn’t need a restrictive diet. She likely needs a systems tweak. North American teens average over 7 hours of daily recreational screen time, according to CDC Youth Risk Behavior Survey data. The highest-yield environmental change is swapping 45 minutes of screen time for 45 minutes of movement—ideally outdoors and with friends.
If the typical school lunch tray includes chocolate milk and pizza, switching to a packed lunch with water, a turkey sandwich on whole grain bread, and baby carrots can subtract roughly 300 empty calories daily without the child actively “dieting.” Over a school year, that modest deficit reshapes the BMI trajectory.
A 30-Day Conversation Shift for Parents
The language surrounding a girl’s weight is as critical as the metric itself. Research consistently links parental weight criticism to a higher risk of disordered eating in daughters. Many pediatric dietitians working with families observe that shifting from weight talk to function talk dramatically changes a girl’s relationship with her body.
Replace “fat” and “skinny” with “strong” and “energized.” The vocabulary shift shapes whether a girl views her body as a project to fix or a vehicle to fuel. For example, instead of saying “You look so slim,” try “You had so much energy on that run today.”
No solo plates. If the family doesn’t eat vegetables, the 12-year-old girl won’t either. The intervention must sit on the dinner table, not on a separate “diet plate.”
The mirror test. A parent’s own body commentary is absorbed as the family standard. Modeling self-acceptance is a protective factor.
Celebrate function over form. Praise the legs that finished a 5K, the arms that lifted a heavy box, or the focus that powered a study session—not the jeans size.
Public Health Context: The female-specific CDC growth charts are validated through NHANES surveys encompassing tens of thousands of American girls. According to a 2025 analysis in the Journal of Pediatrics, using unisex BMI charts misclassifies approximately 7.2% of adolescent girls as overweight when they are actually developmentally normal. Public health analysts emphasize that sex-specific screening is not optional—it is foundational to accurate assessment. This article is based on U.S. CDC standards; families in other countries should refer to their own national health department growth charts for the most appropriate benchmarks.
Frequently Asked Questions
At what age does a girl need her own BMI chart instead of a standard one?
The CDC recommends sex-specific charts starting at age 2. However, the clinical significance of separate charts becomes apparent around age 8 or 9 when body fat distribution begins to diverge. By age 10, the fat mass accumulation in girls is substantially underway, making female-specific percentiles non-negotiable for accurate screening.
My daughter started her period early. How does that change how I read her BMI percentile?
Early menarche (before age 12) is associated with a slightly higher BMI trajectory in adolescence. The BMI may jump percentiles shortly after the first period, which is a normal physiological consequence of estrogen. The key indicator is whether she continues to grow taller over the next two years. Linear growth after menarche averages about 2 to 3 inches (5 to 7.6 cm) total. If height stalls immediately while BMI climbs, that warrants a checkup.
How much will my daughter’s BMI change after her first period?
On average, girls gain approximately 1–2 BMI points in the year following menarche as fat mass increases under the influence of cycling estrogen. This does not signal a health crisis. The trend should stabilize within two years as height growth completes. A sustained rise beyond that point may need a pediatrician’s review.
Is a BMI of 21 healthy for a 13-year-old girl?
For a 13-year-old girl, a BMI of 21 typically falls between the 50th and 75th percentile on CDC charts, depending on exact age in months. This is solidly within the healthy weight range. The more important question is whether that number is stable or rising rapidly without corresponding height growth.
Can a body fat scale replace a girls BMI calculator?
Public health analysts on our team generally advise against relying on consumer body fat scales for teen girls. The menstrual cycle causes significant hydration fluctuations that can skew results by 3–5% in a single day. Waist circumference measurement is far more reliable and consistent for tracking metabolic health in this age group.
How often should I recalculate my daughter’s BMI?
For girls ages 9–14, every six months provides useful data without creating an obsessive atmosphere. For ages 5–8 or 15–19, annual checks are sufficient unless a pediatrician recommends more frequent monitoring.
Content Integrity Review: The percentile classifications and growth chart logic in this article have been reviewed for alignment with CDC clinical growth charts and AAP 2023 guidelines. This content is strictly educational and does not constitute individual dietary or health advice for any child. Last Reviewed: May 30, 2026.
Prepared based on CDC sex-specific BMI-for-age percentile data, AAP clinical practice guidelines for pediatric obesity (2023), NHANES body composition reference data for adolescent females, and a 2025 analysis of sex-specific screening accuracy published in the Journal of Pediatrics.
Sources
BMI Calculator Blog. This content is provided for educational and informational purposes only. We encourage sharing with proper attribution to our site. Unauthorized commercial use is prohibited. Medical Disclaimer: The content of this article is for informational purposes only and does not replace professional medical advice, diagnosis, or treatment. Always seek the advice of a qualified pediatrician or other qualified health provider with any questions regarding your daughter’s growth, weight, or overall health.