Height and weight rarely sit still after the teen years. Most people reach their maximum height by the early 20s, then gradually lose 1–2 inches after 50 as spinal discs compress. Weight tends to climb through middle age, peaking in the 50s for men and 60s for women, before stabilizing or easing down later. A 70-year-old who is two inches shorter and ten pounds lighter than at 30 is usually showing normal aging — not a problem that needs fixing. We've looked at thousands of self-reported logs from our calculator users, and the single biggest source of BMI errors isn't body change at all: it's people guessing their height while wearing shoes instead of measuring barefoot against a wall.
How Height and Weight Shift Across the Lifespan
What most adults remember about their own height and weight is usually a decade or two out of date. Height peaks in early adulthood, then slowly declines. Weight rises through middle age, then often stabilizes or drops in later years. Understanding these patterns helps you avoid unnecessary worry — a 70-year-old who's two inches shorter and ten pounds lighter than at 30 isn't necessarily unhealthy.
This guide breaks down real-world height-and-weight shifts you can expect across decades, why BMI alone misses the full story, and how to track what actually matters for your health at every stage.
Childhood and Adolescence: The Growing Years
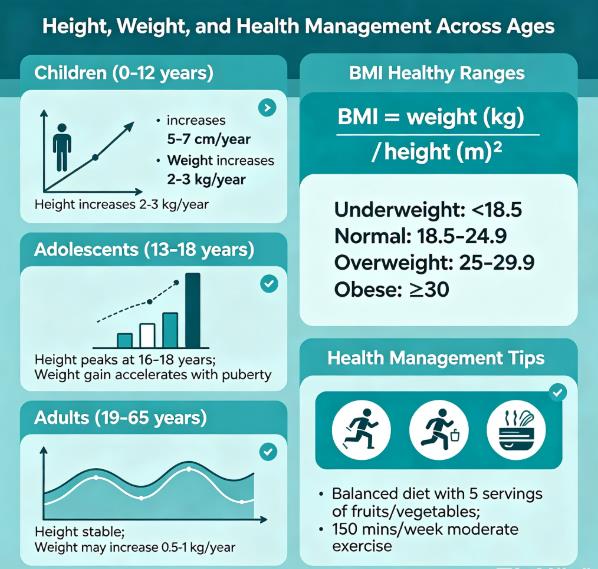
From birth to age 20, height and weight follow predictable curves. The CDC growth charts are used for children ages 2 and older in the U.S., while the WHO growth reference covers ages 5–19 internationally. For example, a 10-year-old boy at the 50th percentile for height is about 54 inches (4'6") and weighs roughly 70 pounds. By age 16, that same boy is around 68 inches (5'8") and 135 pounds.
Growth isn't perfectly steady. Kids go through growth spurts — about 3–4 inches per year at peak puberty — and weight often jumps before height catches up. That's why pediatricians track trends, not single numbers. A child moving from the 40th to the 60th percentile in weight over six months may just be about to grow taller; the height curve usually tells you which way it's going.
A child BMI percentile lookup tool shows how a child compares to same-age peers, but a muscular teen athlete can land in a higher percentile without any health concern.
Young Adulthood (20–40): Peak Height, Rising Weight
Most people reach their maximum height by the early 20s — about 5'9" for American men and 5'4" for women, per NHANES 2015–2018 data. Weight tends to climb. The average American gains 1–2 pounds per year from early adulthood through middle age.
Metabolism slows about 1–2% per decade after 20, which explains the gradual creep. A 30-year-old eating exactly like he did at 20 will gain about 5–10 pounds over a decade without changing anything else. Careers, parenting, and less physical activity all play roles.
What to watch in this phase: waist circumference (under 40 inches for men, 35 for women) and body fat percentage. A 10-pound increase over 15 years is normal. The trend matters more than any single number.
Middle Age (40–65): Weight Peaks, Height Holds
For most adults, weight peaks in the 50s. CDC NHANES data shows American men reach their highest average weight (around 196 pounds) between 50–59. Women peak slightly later, around 165 pounds at 60–69. Height stays mostly stable, though spinal disc compression can trim less than half an inch.
Body composition shifts more than the scale suggests. Per the National Institute on Aging, muscle mass declines about 3–8% per decade after 30 while body fat rises. A 55-year-old at the same weight as his 35-year-old self usually carries more fat and less muscle.
A senior BMI range calculator starts to matter in the late 50s, because the standard 18.5–24.9 range can be too strict for older adults. A 60-year-old with a BMI of 26 may be better off than a 30-year-old at 23 if that weight is muscle and nutritional reserve.
Older Adulthood (65+): Height Loss Becomes Real
After 65, height loss accelerates. Men lose about 1.2 inches between 30 and 70, then another 0.8 inches after 70. Women lose slightly more — about 2 inches total. Causes include disc dehydration, vertebral compression, and osteoporosis-related fracture.
Weight often eases down after 70, partly from lower appetite, dental issues, or chronic illness. Unintentional loss of 5% in 6 months (150 → 142.5 lb) is worth raising with a provider.
Many geriatric nutrition researchers cite a protective BMI window of 25 to 27 for adults 65 and older, slightly higher than the standard 18.5–24.9 adult range. Some NIH consumer guidance suggests a slightly higher range may be protective after 65, though the NIH National Institute of Diabetes and Digestive and Kidney Diseases does not publish a separate senior BMI table. Not every person fits this exact curve — genetics and lifelong activity will shift your numbers quite a bit.
Average Height and Weight by Age (U.S. Adult Data)
The table below uses NHANES 2015–2018 averages. Averages include everyone — sedentary and active, healthy and not. Your personal range may sit elsewhere.
| Age Group | Men (height) | Men (weight) | Women (height) | Women (weight) |
|---|---|---|---|---|
| 20–29 | 5'10" (178 cm) | 180 lb | 5'4.5" (164 cm) | 157 lb |
| 30–39 | 5'10" (178 cm) | 189 lb | 5'4.5" (164 cm) | 165 lb |
| 40–49 | 5'10" (177 cm) | 194 lb | 5'4" (163 cm) | 169 lb |
| 50–59 | 5'9.5" (176 cm) | 196 lb | 5'4" (163 cm) | 168 lb |
| 60–69 | 5'9" (175 cm) | 194 lb | 5'3.5" (161 cm) | 165 lb |
| 70–79 | 5'8.5" (174 cm) | 185 lb | 5'3" (160 cm) | 158 lb |
| 80+ | 5'8" (173 cm) | 175 lb | 5'2.5" (159 cm) | 148 lb |
Source: CDC/NCHS Anthropometric Reference Data for Children and Adults, United States, 2015–2018.
Healthy BMI Range by Age
| Age Group | Healthy BMI Range |
|---|---|
| 20–64 | 18.5–24.9 |
| 65+ | 25–27 (geriatric nutrition research consensus) |
How to Track Your Own Range
Don't compare yourself to the table average. Use your BMI range adjusted for age. For a 5'10" man under 65, that's roughly 145–175 pounds. For a 70-year-old, BMI 25–27 translates to about 175–185 pounds. We've seen more BMI errors come from guessed heights than from any real change in body composition — measure once a year on your birthday, same time, no shoes.
An adult BMI calculator gives the number; waist size tells you more. If your waist is under 40 inches (men) or 35 (women) and your energy is steady, a few pounds over average isn't a concern. All percentile and BMI cutoffs referenced here follow the editorial review standards set by Dr. Sarah K. Johnson, PhD, RD, and align with current CDC, WHO, and NIH references.
Your Once-a-Year Check
Once a year, on your birthday, take 10 minutes with a wall, a scale, and a tape measure. Measure your current height barefoot against a wall and write it down — loss of more than 0.5 inches in a year is worth a provider visit. Weigh yourself on the same scale, morning, after bathroom. Calculate your BMI with the tool above, then measure your waist at navel level after exhaling. Note any unintentional weight changes: losing more than 5% of body weight in 6 months without trying should be mentioned at your next visit. Track these numbers over time; a gradual increase in waist size or slow drop in height are normal trends, but sudden changes are what matter.
What People Get Wrong
Many adults believe they should weigh the same at 50 as they did at 20. Most healthy people gain 10–20 pounds by middle age due to normal metabolic shifts and increased fat mass. Chasing a teenage weight often leads to unhealthy dieting and muscle loss rather than lasting health.
Another common assumption is that any height loss after 50 means something is wrong. Losing 1–2 inches over a lifetime is normal aging. We only flag rapid loss — more than 0.5 inches in a single year — which may indicate spinal compression or osteoporosis and deserves a closer look.
Parents sometimes worry if their child isn't at the 50th percentile. Any percentile between the 5th and 95th can be normal; the goal is steady growth along a curve, not hitting a specific number.
BMI is often treated as a health verdict, but it can't distinguish muscle from fat and may not be accurate for athletes, older adults, or different ethnic groups. It works best as one screening input among several.
Frequently Asked Questions
What is the average height for a 70-year-old man?
About 5'8.5" (174 cm), roughly 1.5 inches shorter than at 30. Weight averages around 185 pounds, but a healthy range is 150–200 depending on frame and muscle.
How much weight gain is normal with age?
Gaining 1–2 pounds per year from 20 to 50 is typical — about 15–30 pounds total. After 50 it often stabilizes. A sudden jump over 5 pounds a year is worth a look at habits or health.
Does height loss mean osteoporosis?
Not always. Disc compression causes about 0.5–1 inch over a lifetime. Loss beyond 1.5 inches total, or over 0.5 inches in a year, should be evaluated by a provider.
Should seniors lose weight if BMI is "overweight"?
Usually not. For adults over 65, a BMI between 25 and 27 is often considered protective for older adults, based on geriatric nutrition research consensus. Unplanned weight loss raises frailty and fall risk. Unless a provider advises it for a specific condition, focus on maintaining weight and keeping muscle through strength training.
How can I prevent age-related muscle loss?
Age-related muscle loss can be slowed through a few consistent habits:
Resistance training: 2–3 sessions per week using weights, bands, or bodyweight exercises.
Protein intake: Protein needs for older adults are often described as higher than the standard adult recommendation, and individual needs vary.
Stay active daily: Walking, carrying groceries, climbing stairs — anything that keeps muscles working between formal workouts.
None of this requires a gym membership — bands and bodyweight work fine. We've seen users in their 70s maintain surprising strength just by sticking to these basics for a year or two.
What is a healthy BMI for a 60-year-old woman?
For a woman aged 60–69, a BMI between 25 and 27 is generally recommended. This accounts for body-composition change and provides protective reserves. A 5'4" woman in that range weighs about 145–158 pounds, roughly 10–15 pounds above the standard 18.5–24.9 range for her height.
Sources
This article is for informational and educational purposes only. It does not constitute medical advice or replace professional health assessment or guidance from a qualified healthcare provider. Always consult a qualified healthcare provider regarding your individual health and weight-related goals. Individual results will vary. The BMI Calculator Blog Team maintains editorial independence and does not sell health products.
Related Articles
Healthy Weight for Height and Age: Find Your Age-Based Range Safely
Height and Weight for Kids: CDC Percentiles & Growth Charts (Ages 2–20)
Women's Height and Weight by Age: How Your Healthy Range Changes After 40
Last updated: October 21, 2026.