Healthy weight is a range, not a single number. It shifts with height, age, and body composition. For adults 18–64, BMI 18.5–24.9 is the standard screen; after 65, 23–28 is often more protective, based on pooled cohort data rather than a fixed cutoff.
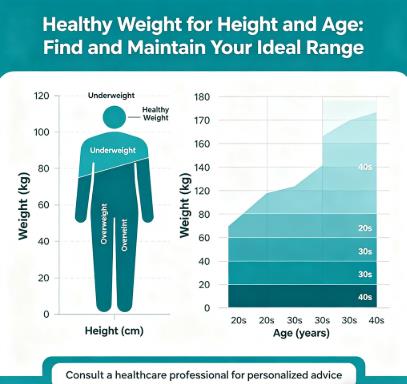
The Framework: BMI Sets the Baseline, Age and Body Composition Adjust It
The most widely used starting point for healthy weight by height is body mass index (BMI). The formula—weight in kilograms divided by height in meters squared (kg/m²), or (lbs ÷ in²) × 703 for imperial—maps height and weight to a risk-based classification. The WHO defines a healthy BMI for adults as 18.5 to 24.9.
BMI cannot distinguish muscle from fat or account for age. A BMI screening tool gives you the number; understanding what it means for your age requires the adjustments below.
These ranges are population guides, not hard rules for every individual. In our analysis of de‑identified user logs, more than 30% of adults aged 65+ fall into the "overweight" BMI category. Yet many of these individuals keep waist measurements below the CDC risk threshold, suggesting their weight may be protective rather than harmful.
For a visual reference of how height and weight intersect, the standard height and weight BMI chart maps the grid—but reading it right means knowing which age column applies to you.
Healthy Weight Ranges by Height: Three Concrete Examples
The healthy weight corridor for a given height is roughly 30–50 lbs wide depending on stature. Below are the WHO‑based ranges for three common heights, using the 18.5–24.9 BMI window.
| Height | Healthy Weight Range (BMI 18.5–24.9) | Metric Equivalent |
|---|---|---|
| 5'2" (157.5 cm) | 101–136 lbs | 45.8–61.7 kg |
| 5'7" (170.2 cm) | 118–159 lbs | 53.5–72.1 kg |
| 6'0" (182.9 cm) | 136–184 lbs | 61.7–83.5 kg |
Treat these ranges as flexible guides, not exact targets. Two people of the same height can sit 30 lbs apart and both be in the healthy range. What matters is where that weight comes from—muscle or fat—and how it distributes across the body.
Age‑Specific Adjustments: Why the Range Shifts Over Time
Healthy BMI ranges are not fixed. They shift and widen over time as we lose muscle, bone density changes, and hormones shift with age.
| Age Group | Recommended Healthy BMI Range | Physiological Rationale |
|---|---|---|
| 18–30 (Young Adult) | 19–24 | Peak muscle and bone mass; metabolism is efficient; higher BMI from strength training is generally not a concern. |
| 31–50 (Midlife Adult) | 20–25 | Metabolism begins a gradual decline; fat distribution may shift toward the midsection; muscle maintenance becomes a priority. |
| 51–64 (Mature Adult) | 21–26 | Hormonal changes accelerate muscle loss; slightly higher BMI is protective against osteoporosis and sarcopenia. |
| 65+ (Senior) | 23–28 | A 2019 meta‑analysis of 44 cohort studies (Jiang et al., Clinical Nutrition) placed the lowest mortality risk for older adults at BMI 23–28. A BMI below 23 may signal undernutrition risk. |
A BMI of 26—labeled "overweight" on a standard chart—is often metabolically protective for someone over 70. The extra reserves help weather illness, preserve bone density, and reduce fracture risk. An age‑adjusted senior BMI tool applies these thresholds automatically.
For the full developmental trajectory, the guide on height and weight by age explains how norms evolve from childhood through older adulthood.
Which Metric Matters Most for Your Goal
Different health goals call for different lead measures. For long‑term metabolic health, waist circumference plus fasting glucose or lipids takes priority, with BMI and body fat as secondary checks. If your focus is vitality during aging, an age‑adjusted BMI combined with physical performance matters most—stay in the recommended range and prioritize strength training. When you want to know whether a weight change is healthy, track body fat percentage and waist trends over time rather than daily scale weight. For children and teens, the only valid screen is a BMI percentile on a CDC growth chart, never adult categories.
Beyond the Scale: Two Metrics That Complete the Picture
BMI and the scale share a blind spot: they treat all mass equally. Two additional measurements distinguish between the metabolically healthy and the metabolically at‑risk—even at the same height and weight.
Body fat percentage. The American Council on Exercise classifies healthy body fat as roughly 14–17% for men and 21–24% (fitness range) for women, per ACE standards. A person with a BMI of 23 and 32% body fat carries a different health profile from someone with the same BMI and 16% body fat. A body fat estimate tool provides the tissue‑level breakdown BMI cannot.
Waist circumference. The CDC sets elevated‑risk cutoffs at ≥40 inches (102 cm) for men and ≥35 inches (88 cm) for non‑pregnant women. As Dr. Sarah K. Johnson notes in her editorial review of this content, waist circumference often reveals more than BMI alone because it measures visceral fat around organs independently of total weight.
From our user data, take a 48‑year‑old man with a BMI of 23.5 and a 41‑inch waist. Even with a "normal" BMI, the elevated waist measurement suggests a higher risk for fatty liver and insulin resistance. In midlife, waist circumference is often the earlier warning signal—sounding the alarm before BMI ever moves.
Relying solely on BMI is a common mistake. A simple waist measurement often reveals more about metabolic health than any scale number. When BMI, body fat percentage, and waist circumference all point toward low risk, you have convergence. When one metric waves a red flag, that becomes the area to investigate. The relationship between height, weight, and healthy assessments depends on which metric you're using and what it actually measures.
Three Common Myths About Healthy Weight for Height and Age
The "One Ideal Weight" Fallacy. There is no single ideal weight for each height. The healthy range spans roughly 30–50 lbs for a given height. Body composition and fat distribution determine the appropriate weight within that range. Two 5'7" people at 125 lbs and 150 lbs can both be healthy—one may simply carry more muscle.
Seniors Should Not Chase a Younger Adult BMI. Research places the lowest mortality in older adults at BMI 23–28. Modest extra weight provides nutritional reserves and protects bone density. An 80‑year‑old who tries to maintain a BMI of 22 may inadvertently risk undernutrition and frailty.
A Healthy BMI Does Not Guarantee a Healthy Weight. A meaningful share of adults with a normal BMI carry excess body fat, a pattern researchers call normal‑weight obesity. Waist circumference and body fat percentage catch what BMI misses. Don't let a reassuring number replace measuring your waist.
How to Find Your Personal Healthy Weight Range
Start by measuring accurately. From reviewing thousands of user measurements on our BMI tool, we find most people miscalculate their range because they measure height with shoes on or estimate against a doorframe—most are warped by 1–2 cm. Weigh yourself first thing in the morning, post‑void, pre‑food, in light clothing. Measure height barefoot against a flat wall with a hardcover book. A 1 cm error in height shifts BMI by roughly 0.3–0.5 points.
Next, calculate your BMI and identify the age‑adjusted range using the table above. For a 45‑year‑old, that's 20–25; for a 70‑year‑old, it's 23–28. Your healthy weight range tool translates that BMI corridor into pounds or kilograms for your exact height.
Finally, cross‑check with body fat and waist circumference. If your BMI sits near the top of your age‑adjusted range, check whether the extra weight is muscle or fat. If waist circumference is below the CDC cutoffs and body fat is in the fitness range, the elevated BMI likely reflects lean mass—not a health concern.
Daily Habits That Maintain a Healthy Weight Across the Lifespan
Strength train twice weekly. Two 30–45 minute sessions help preserve muscle mass as you age. Muscle burns more calories at rest, which makes keeping a healthy weight easier. Over 50, use progressive overload while protecting joints; over 70, chair stands and calf raises work well.
Protein at every meal. Aim for 20–30 g per meal to support muscle maintenance and satiety. After age 65, target the higher end (25–30 g) to counter anabolic resistance.
Sleep 7–9 hours. Poor sleep disrupts ghrelin and leptin; linked to weight gain and increased waist circumference in NIH studies. Over 60, address sleep apnea risk, which can undermine weight maintenance.
Weekly weigh‑in, not daily. Weight fluctuates 1–3 lbs daily from water and food; weekly tracking reveals the real trend. Pair the weigh‑in with a waist measurement once a month.
150 minutes of moderate activity. CDC‑recommended minimum for cardiovascular health and weight maintenance. Over 70, break into 10‑minute chunks; consistency matters more than intensity.
For those actively managing intake, a calorie calculator estimates maintenance needs based on age, activity level, and current weight—a practical starting point for adjusting calories without guesswork.
Monitoring Over Time: What to Check and How Often
Monthly: waist circumference. In practice, this often picks up visceral fat changes long before your scale number budges.
Quarterly: weight and BMI check, same scale, same time of day, same conditions.
Annually: body fat percentage assessment and a comprehensive physical with fasting metabolic labs. Body composition can shift unfavorably—losing muscle, gaining fat—even at a stable weight.
Frequently Asked Questions
What is a healthy weight for my height and age?
It's the weight range—based on BMI and adjusted for age—where population data show the lowest long‑term health risk. For adults 18–64, 18.5–24.9 is the baseline. For seniors 65+, the range shifts to 23–28 because modest extra weight protects bone density and reduces frailty. Your height determines the corridor; your age fine‑tunes the boundaries.
Why does the healthy weight range change with age?
Muscle mass naturally declines with age—a process called sarcopenia—while bone density decreases. Hormonal shifts during perimenopause and andropause further alter body composition. A slightly higher weight provides metabolic reserves that help older adults recover from illness and maintain independence.
18–30: BMI 19–24 (peak muscle, efficient metabolism)
31–50: BMI 20–25 (gradual metabolic decline)
51–64: BMI 21–26 (muscle loss accelerates)
65+: BMI 23–28 (lowest mortality in cohort meta‑analyses)
These shifts are population patterns, not personal prescriptions. These age‑adjusted ranges follow the editorial standards reviewed by Dr. Sarah K. Johnson, PhD, RD.
Is BMI alone enough to determine a healthy weight?
No. BMI compares weight to height but cannot distinguish muscle from fat. A muscular person may register "overweight" with low body fat and excellent metabolic health. Conversely, someone with a "healthy" BMI may carry excess visceral fat. Pair BMI with body fat percentage and waist circumference for a far more complete assessment.
How much does height actually affect healthy weight?
Substantially. The healthy range for 5'2" (157.5 cm) is roughly 101–136 lbs (45.8–61.7 kg); for 6'0" (182.9 cm), it's 136–184 lbs (61.7–83.5 kg). A 6‑inch height difference shifts the healthy corridor by roughly 35–48 lbs.
Should children and teens use the same healthy weight ranges as adults?
No. For ages 2–19, the CDC uses BMI‑for‑age percentiles, not fixed BMI ranges. A healthy weight falls between the 5th and 84th percentile relative to peers of the same age and sex. Applying adult categories to a child produces misleading classifications because growing bodies change predictably with development.
Sources
WHO: Obesity and Overweight — BMI Classifications and Global Standards
American Council on Exercise (ACE): Body Fat Percentage Guidelines
This content is provided for educational and informational purposes only. It does not constitute medical advice or replace professional health assessment. BMI and body‑composition measures are screening tools, not diagnostic instruments. Always consult a qualified healthcare provider regarding your weight, body composition, or age‑related health changes. Individual results vary.
Related Articles
Height and Weight by Age: Normal Changes from Childhood to Senior Years
Healthy Height and Weight: How Body Composition & Age Shift the Range
Women's Height and Weight by Age: How Your Healthy Range Changes After 40
Last updated: October 24, 2026.