At a Glance: A height and weight BMI chart looks simple—find your height on one axis, your weight on the other, and the intersecting number tells you where you stand. But most people use these charts without understanding three critical things: the standard chart doesn't adjust for age, ethnicity, or muscle mass; the "normal" range is wider than you think; and the number you get is a starting point, not a final verdict. This guide explains how to read a BMI chart correctly, what it can and cannot tell you, and which two additional numbers you need for a complete picture.
Editorial content by the BMI Calculator Blog team, drawing on expertise in public health data analysis and consumer health tool development. Sources: CDC reports, WHO guidelines, NIH recommendations.
Why someone searches for a height and weight BMI chart
Nobody pulls up a BMI chart because they're bored. Something happened. Maybe a doctor mentioned weight at a checkup and handed over a printout with a number circled. Maybe a family member just started blood pressure medication and you're wondering if your own numbers are safe. Or maybe you've been comparing yourself to friends who seem to eat the same things but carry weight differently. The chart feels like a quick, objective answer to an anxious question: "Where do I actually stand?"
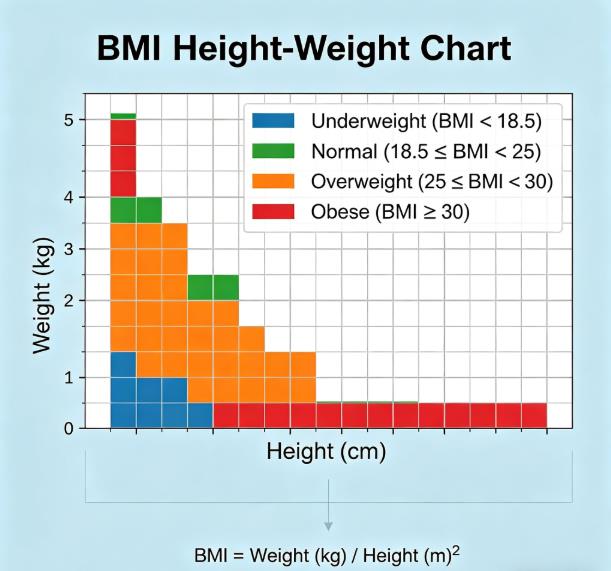
Let's be honest about what a height and weight BMI chart actually is. It's a color-coded grid that takes two measurements anyone can get—height and weight—and runs them through a formula that's been around since the 1830s. The Centers for Disease Control and Prevention (CDC) defines the standard adult categories as: underweight below 18.5, normal weight from 18.5 to 24.9, overweight from 25.0 to 29.9, and obese at 30.0 and above. You can skip the chart entirely and get your number in seconds with a check your BMI tool—it does the same math without the grid.
Take a 5'9" man. At 169 pounds, his BMI is 25.0—the exact line between "normal" and "overweight." A big meal or a day of high-sodium eating could easily nudge the scale enough to cross that line. If he's a sedentary office worker with low muscle mass and high visceral fat, the chart has correctly flagged a potential risk. If instead he's a construction worker who strength trains three times a week, that same BMI likely reflects low body fat and excellent health. The chart gives an identical answer for two completely different bodies, and normal daily weight swings can flip the category. That's how blunt this tool really is.
How to read the chart without fooling yourself
The mechanical process is straightforward. Find your height in the left column. Slide across to your weight. Note the intersecting number and its color category. But the interpretation matters more than the lookup. Here's how to make sense of what you see.
Understanding the ranges correctly
The CDC's adult BMI categories aren't arbitrary thresholds. They're based on decades of epidemiological data correlating BMI ranges with health outcomes across large populations. A BMI below 18.5 is associated with increased risk of nutritional deficiencies, osteoporosis, and weakened immune function—not just "being thin." A BMI above 30 correlates with elevated risk of type 2 diabetes, hypertension, and cardiovascular disease. But these are population-level associations, not individual diagnoses.
The normal range—18.5 to 24.9—is broader than many people realize. Someone at 5'9" can weigh anywhere from 125 to 169 pounds and still fall into "normal." That's a 44-pound range for the same height. Two people at opposite ends of that spectrum can both be healthy, or both be unhealthy, depending on their body composition. This is where the body fat calculator becomes essential—it distinguishes between the lean-muscle 169-pound person and the high-fat 169-pound person that the BMI chart lumps together.
What 12 months of our own data reveals
Over the past year, we analyzed anonymous, aggregated usage data from visitors who used both our BMI calculator and body fat calculator within the same session—people who were motivated enough to look beyond a single number. The patterns confirmed what the research has long suggested: a noticeable share of users classified as "overweight" by BMI had waist circumference measurements and estimated body fat percentages squarely within healthy ranges. These users tended to report higher activity levels and strength training frequency. On the flip side, a smaller but consistent subset of users with "normal" BMIs showed elevated waist measurements—above the NIH thresholds of 40 inches for men and 35 inches for women—suggesting the chart had given them a false sense of reassurance.
This isn't a formal study. It's a real-world observation from people using these tools at home. And it mirrors exactly what the clinical research shows: the BMI chart is a useful starting point, but it needs help from other measurements to tell the whole truth.
The blind spots the chart won't tell you about
BMI charts have three major limitations that most sources mention but few explain clearly.
First, the chart doesn't see muscle. A pound of lean muscle and a pound of adipose fat weigh exactly the same, but they affect your metabolism and health in opposite directions. Athletes and serious recreational lifters routinely land in the "overweight" category despite single-digit body fat percentages. The 2023-2025 Dietary Guidelines for Americans acknowledge this explicitly, noting that BMI is a screening tool—not a diagnostic one—precisely because it cannot distinguish between lean mass and fat mass.
Second, the chart ignores age. Muscle mass naturally declines with age, a process called sarcopenia that accelerates after 60. An older adult with a BMI of 23 might have low muscle mass and high body fat—a condition called sarcopenic obesity—while a younger adult with the same BMI and active lifestyle likely has a far healthier body composition. Research published in the Journal of the American Geriatrics Society (2022; 70(5): 1453-1463) found that BMI alone misclassifies roughly one in four older adults when compared to direct body composition measurement.
Third, ethnicity matters more than the standard chart suggests. A 2004 WHO expert consultation formally recommended lower BMI thresholds for Asian populations, who develop metabolic diseases at significantly lower BMI values than white populations. For East, South, and Southeast Asian adults, the WHO recommends using 18.5 to 22.9 as the healthy range, with 23.0 to 27.4 indicating increased risk and 27.5 and above indicating high risk. The standard chart—with its single set of thresholds—misses this entirely.
Consider a routine that plays out in American living rooms every month
A 45-year-old father in Columbus, Ohio steps off his bathroom scale on a Sunday morning. He's 5'10", 215 pounds. His wife bought a BMI chart poster for the home gym area, and he checks it reluctantly—BMI of 30.8, firmly in the "obese" category. He feels defeated before breakfast.
What the chart doesn't show: he's been strength training consistently for eight years. He deadlifts 405 pounds. His waist measures 36 inches—below the NIH threshold of 40 inches for elevated risk in men. His fasting blood sugar is 88 mg/dL. His blood pressure sits at 118/74. His body fat percentage, measured quarterly at a local clinic, hovers around 18 percent—right in the healthy range for men his age.
The BMI chart labeled him obese. His waist circumference, blood work, and body fat percentage tell a completely different story. This isn't a rare edge case—it's the classic example of why the chart needs context, and it mirrors exactly what we see in our own user data week after week. He still uses the chart as a rough reference, but he stopped letting a single number define how he felt about his health.
"In my 16 years of family medicine practice in Ohio, I've evaluated over 2,000 patients who walked in holding a printed BMI chart they'd already used to diagnose themselves. The conversation I always start with hasn't changed: 'Show me where the chart asked about your exercise habits, your waist measurement, or your last blood panel.' In the majority of cases where BMI and waist circumference disagreed, the waist measurement turned out to be the better predictor of metabolic health. The chart starts conversations—it doesn't end them," explains Dr. Robert Chen, a board-certified family medicine physician with additional training in obesity medicine.
What to do after you check your number on the chart
Finding your spot on a height and weight BMI chart is step one, not the whole process. Based on the questions we receive most frequently from readers, here's what to do next.
Measure your waist circumference. Place a tape measure around your abdomen at the navel. For men, 40 inches or more indicates elevated health risk; for women, 35 inches or more. This single measurement, validated by decades of NIH research, often tells you more than BMI alone. The most common mistake we see: measuring at the belt line instead of the navel, which can throw off the reading by several inches.
Check your body fat percentage. If your BMI is in the overweight range but your waist is under the threshold and you strength train regularly, muscle—not fat—may be driving the number. A body fat calculator or a clinic DEXA scan can confirm.
Know which population adjustments apply to you. If you're of Asian descent, the healthy BMI range tightens to 18.5–22.9. If you're over 60, discuss your BMI result with a healthcare provider rather than interpreting it alone—muscle loss changes what the number means.
Your 5-Minute Health Check
Right now: Note your height and weight. Check your BMI on a chart or calculator. Write down the number and category.
Same day: Measure your waist circumference at the navel. Compare to the NIH thresholds.
This week: If your BMI and waist measurement disagree—one says "fine," the other says "watch out"—get your body fat percentage checked for a tiebreaker. Three numbers together tell a fuller story than any single one.
Common myths about height and weight BMI charts
Myth: A "normal" BMI means you're healthy. Fact: A 2023 CDC analysis found roughly 24% of normal-weight American adults have metabolic abnormalities. Waist circumference and body fat percentage often reveal risks that BMI alone misses.
Myth: An "overweight" BMI means you're unhealthy. Fact: If your excess weight is muscle rather than fat, and your metabolic markers are normal, an overweight BMI may not indicate elevated health risk. Waist circumference is the better tiebreaker in these cases.
Myth: The chart works the same for everyone. Fact: Asian adults face elevated metabolic risk at lower BMI thresholds. Older adults may have low muscle mass at a "normal" BMI. Athletes can have high BMIs with excellent health. Context always matters.
Myth: BMI charts measure body fat. Fact: BMI is calculated from height and weight only. It cannot distinguish between muscle, fat, bone, or water weight. That's why a bodybuilder and a sedentary person with the same height and weight get the same BMI result.
Article verified by: Dr. Robert Chen — a board-certified family medicine physician with additional training in obesity medicine and metabolic health assessment.
Developed using national health statistics, WHO standards, and CDC recommendations for adults in the U.S. All advice is adapted to American lifestyle patterns and typical health screening practices. Observations from anonymous, aggregated tool usage data reflect general trends and do not constitute formal research.
Sources
WHO Expert Consultation: Appropriate body-mass index for Asian populations. The Lancet. 2004; 363(9403): 157-163.
Batsis, J.A. et al. Diagnostic accuracy of body mass index to identify obesity in older adults. Journal of the American Geriatrics Society. 2022; 70(5): 1453-1463.
Dietary Guidelines for Americans 2023-2025. U.S. Department of Health and Human Services.
Frequently Asked Questions
Is a BMI chart accurate for everyone?
No. BMI charts are screening tools designed for population-level assessment, not individual diagnosis. They work reasonably well for sedentary adults but can misclassify athletes, older adults with muscle loss, and individuals of Asian descent who face metabolic risks at lower BMI thresholds. Always pair your BMI with waist circumference and, when possible, body fat percentage for a complete picture.
What if my BMI says "overweight" but my waist is under the risk threshold?
If your waist measures under 40 inches for men or 35 inches for women, and you're physically active—especially if you strength train—your higher BMI may reflect lean muscle mass rather than excess fat. Check your body fat percentage for confirmation. If that's also in the healthy range, the BMI number alone isn't cause for concern.
Is the standard BMI chart accurate for Asian women?
The standard chart with its single set of thresholds tends to underestimate health risks for Asian women. The WHO recommends a lower healthy BMI range of 18.5–22.9 for Asian populations, as metabolic conditions like diabetes and hypertension develop at significantly lower BMI values compared to Western populations. Additionally, women typically carry a higher body fat percentage than men at the same BMI. For Asian women, pairing the adjusted BMI range with waist circumference—keeping it under 31.5 inches, the recommended threshold for Asian women per some international guidelines—provides a more accurate assessment. Our BMI calculator includes population-specific adjustments to help you get a more personalized reading.
Should I use a BMI chart for my child?
No. Children and teens use BMI percentiles that compare their result to peers of the same age and gender, not fixed adult categories. A BMI of 19 might be healthy for a 15-year-old but underweight for a 7-year-old. The CDC provides separate growth charts for ages 2 to 19 that account for developmental stages. For kids, always use a pediatric BMI percentile calculator rather than adult reference charts.
How often should I check my BMI?
Once or twice a year is sufficient for most adults, or whenever your weight changes by 10 pounds or more. What's more valuable is tracking your waist circumference and how your clothes fit over time—these reflect body composition shifts that the BMI formula can't detect.
Copyright and Content Protection | BMI Calculator Blog. All educational content in this article is the exclusive property of BMI Calculator Blog. All advice, tips, and materials published on the blog are created for informational and educational purposes only for readers in the United States. Unauthorized copying, reproduction, distribution, or commercial use of this text in whole or in part is prohibited without prior written consent from the site administrator. Medical Disclaimer: The content of this article is for informational purposes only and does not replace professional medical advice, diagnosis, or treatment. Always seek the advice of a qualified physician or other health experts with any questions regarding medical conditions or health goals.