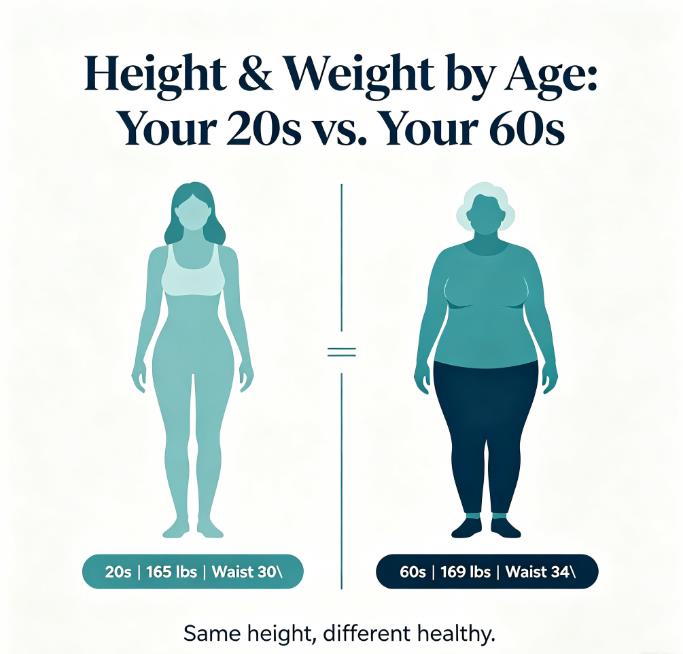
Your height doesn't change much after 20, but your weight — and what's "healthy" for you — does. For women, weight tends to rise through midlife, then often drops after 60. The CDC's BMI categories (18.5–24.9) stay the same at every adult age, but your body composition shifts with each decade. Adult women share one fixed BMI chart, yet average weight climbs through the 40s before dropping after 60 — often from muscle loss, not fat loss. Waist over 35 inches is a risk signal regardless of BMI, and for women over 65, a BMI of 24–27 may be more protective than the low end of the standard range. Here's what to expect — and why a chart is never the full picture.
What "Height and Weight by Age" Means for Women
Height and weight by age is the relationship between how tall you are, how much you weigh, and where you are in life. For adult women, height is mostly fixed after the teen years — but weight can change significantly across your 20s, 40s, 60s, and beyond. CDC data shows that the average American woman aged 20 and older is about 5 feet 3.5 inches tall and weighs roughly 172 pounds. But averages don't tell you what's healthy for your body at your age.
What the CDC actually uses to define healthy weight is BMI (body mass index) — your weight relative to your height. For adults 20 and older, the categories are the same regardless of age, sex, or race: Underweight (below 18.5), Healthy weight (18.5 to 24.9), Overweight (25 to 29.9), Obesity (30 or greater). A 25-year-old and a 65-year-old use the same BMI chart, but their bodies aren't the same. That's where interpretation matters — not in the formula, but in how you read the result.
What the Numbers Look Like by Decade
Here's what average weights look like for women at different stages of life, based on NHANES August 2021–August 2023 data:
20–29 years: ~165 lbs
30–39 years: ~178 lbs
40–49 years: ~177 lbs
50–59 years: ~180 lbs
60–69 years: ~171 lbs
70–79 years: ~163 lbs
80+ years: ~150 lbs
Weight tends to climb through your 30s and 40s, then gradually drops after 60. Women in their thirties typically weigh around 178 pounds — that's up from the 165-pound average in their twenties. That extra weight often reflects normal shifts in muscle mass and fat distribution, not a health crisis on its own. Based on anonymized data from women using our BMI calculator, users over 60 who fall in the 24–27 BMI range often report better energy levels than those targeting 22 — consistent with research on healthy aging. For a quick check, use our Adult BMI Calculator.
Why BMI Stays the Same — But Your Body Doesn't
The CDC's categories are "age-independent" for adults. A BMI of 24 is considered "healthy" whether you're 22 or 72. But the chart doesn't capture what changes underneath. Muscle loss means an older woman at the same BMI as a younger woman likely has more body fat and less muscle. That's just part of aging — and it's why BMI alone can be misleading for older adults.
Menopause shifts fat from hips and thighs to the belly. This visceral fat is more metabolically active and carries different health risks than subcutaneous fat. Waist size becomes a more important health marker than BMI for women in their 50s and beyond. Bone density changes after menopause can also lower weight — but not necessarily in a healthy way.
Some research suggests that a BMI in the 24–27 range may actually be protective for women over 65 against frailty and osteoporosis. So while the number doesn't change with age, what that number means for your health does change.
Height and Weight Chart for Adult Women
Based on the CDC's BMI categories (18.5–24.9), here are healthy weight ranges by height for women:
4'10" (147 cm): 91–119 lbs (41–54 kg)
5'0" (152 cm): 97–127 lbs (44–58 kg)
5'2" (157 cm): 104–135 lbs (47–61 kg)
5'4" (163 cm): 108–145 lbs (49–66 kg)
5'6" (168 cm): 115–154 lbs (52–70 kg)
5'8" (173 cm): 122–164 lbs (55–74 kg)
5'9" (175 cm): 125–168 lbs (57–76 kg)
5'10" (178 cm): 129–174 lbs (59–79 kg)
These ranges give you a target zone. But if you're over 65, a slightly higher weight might actually be better for you. The chart is a guide, not a hard verdict — your unique health context always carries more weight.
How to Use This Information
Start by getting your BMI with our calculator. Then check where you fall on the height chart above — are you in the healthy range for your height? Your waist measurement matters too: for women, over 35 inches (88 cm) is a risk signal even with a "normal" BMI. And if you're over 65, a BMI between 24 and 27 may be protective. Don't chase a number that was designed for someone 40 years younger. For age-specific context, check your healthy weight range. Individual health needs vary — discuss your results with a qualified professional.
Frequently Asked Questions
What is a healthy weight for a woman by age?
Short answer: it depends on your height, not your age. A 5'4" woman has a healthy BMI range of 108–145 lbs at any adult age. But for women over 65, a BMI of 24–27 may be more protective — and a qualified professional can help you interpret what's right for your body.
Why does weight increase with age for women?
Muscle loss, hormonal changes (especially around menopause), and lifestyle shifts all contribute. The average woman in her 40s weighs about 12 lbs more than the average woman in her 20s. That's not a warning sign on its own — it reflects what happens to muscle mass and fat distribution over time.
Is the BMI calculation different for women and men?
No. The formula is identical. But women naturally have more body fat than men, so the same BMI may mean different things for women versus men. That's why waist measurement and overall body composition matter alongside the number.
Does menopause affect healthy weight?
Yes. Falling estrogen levels during menopause often change how your body stores energy. Many women notice their scale reading creeps upward even when eating and exercising habits stay the same. Tracking waist size alongside BMI helps separate normal hormonal changes from meaningful health risks.
Should older women aim for a lower BMI?
Evidence increasingly points to a slightly higher BMI carrying less harm — and possibly more benefit — for women in their later years, as body weight provides metabolic reserve against frailty. The goal is maintaining muscle and mobility, not hitting a number from your 20s.
Sources
This article is for informational and educational purposes only. It does not constitute medical advice or treatment. Always consult a qualified healthcare provider regarding your individual health and body composition goals. Individual results will vary. The BMI Calculator Blog Team maintains editorial independence and does not sell health products.