“Ideal body weight in pounds” is a BMI-based range, not a fixed number. For a 5′6″ adult, the healthy window runs roughly 118–155 lbs — a 37-pound spread that no single formula can collapse into one answer. The four classic formulas produce numbers between 121 and 133 lbs for that same height. The range is the answer. The single number was never the question worth asking.
| Height | Healthy weight range (lbs) | BMI band |
|---|---|---|
| 5′0″ (152 cm) | 97–127 | 18.5–24.9 |
| 5′2″ (157 cm) | 104–135 | 18.5–24.9 |
| 5′4″ (163 cm) | 108–145 | 18.5–24.9 |
| 5′6″ (168 cm) | 118–155 | 18.5–24.9 |
| 5′8″ (173 cm) | 125–163 | 18.5–24.9 |
| 5′10″ (178 cm) | 132–173 | 18.5–24.9 |
| 6′0″ (183 cm) | 140–183 | 18.5–24.9 |
Source: CDC Adult BMI Categories. Ranges rounded to the nearest pound; screening bands for non-athletic adults age 20 and older.
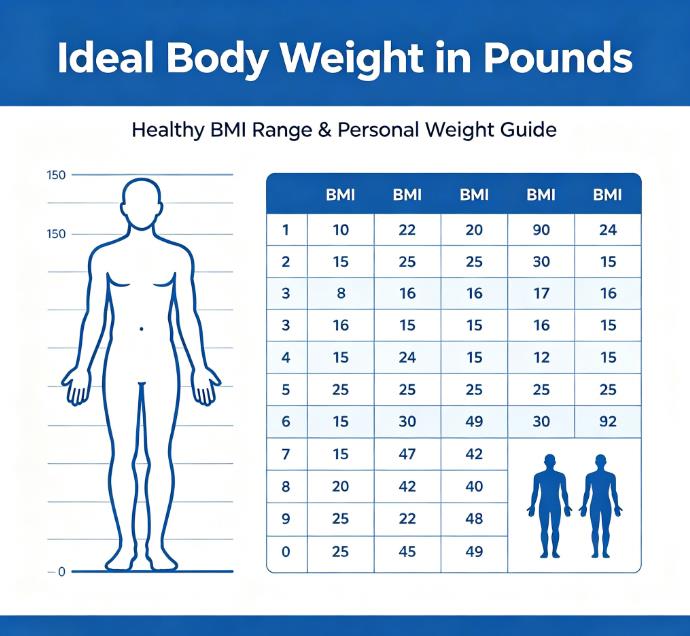
What “ideal body weight” actually means in pounds
The phrase traces back to 19th-century life insurance tables, not to modern health assessment. Broca’s formula — height in centimeters minus 100 — appeared in 1871. Hamwi followed in 1964, Devine in 1974, Robinson and Miller in 1983. Each produced a slightly different number for the same person.
The disagreement is measurable. Across the four formulas, ideal body weight can shift by double-digit percentages depending on which equation you pick and whether the subject is male or female. For a 5′6″ woman, the range runs from roughly 121 lbs (Devine) to 133 lbs (Miller). Twelve pounds between four formulas that all claim to describe the same body.
None of those formulas was designed for personal weight goals. Devine was built for drug dosing — gentamicin pharmacokinetics correlated with ideal body weight, and the equation followed. Hamwi was a clinical quick estimate. Robinson and Miller refined the math but kept the same clinical orientation. They are tools from another context, applied to a question they were never meant to settle.
Why two people at the same BMI can be in completely different health territory
A number on a chart is the starting point. Body composition decides what happens next.
Consider two men at 5′10″. One weighs 190 lbs with 12% body fat and a 32-inch waist. His BMI reads 27.3 — “overweight.” The other weighs 170 lbs with 28% body fat and a 38-inch waist. His BMI reads 24.4 — “healthy.” The chart says the first man is at risk and the second is fine. The body fat and waist data say the opposite.
That mismatch is not rare. Romero-Corral and colleagues analyzed 6,171 adults with BMI in the normal 18.5–24.9 range from NHANES III, published in the European Heart Journal in 2010. Those in the highest body-fat tertile — more than 23.1% in men and 33.3% in women — had a four-fold higher prevalence of metabolic syndrome compared with the lowest tertile (16.6% vs 4.8%). Women with normal-weight obesity showed a 2.2-fold increased risk for cardiovascular mortality (HR 2.2; 95% CI, 1.03–4.67) after adjustment. Normal BMI, high body fat, elevated risk. The scale never flagged it.
We see this pattern in our own site data. Users who run their numbers through the online BMI calculator and then check body fat frequently land in the “healthy BMI, elevated body fat” bucket. The BMI band gave them a green light. The body-fat number said otherwise. A body fat calculator adds the layer BMI cannot measure.
Where the range moves: age, ethnicity, and waist
The standard 18.5–24.9 band is a baseline. Two adjustments shift it for large groups, and a third measurement cuts across both.
For Asian adults, the WHO 2004 expert consultation identified further public health action points at 23.0 and 27.5 kg/m². The consultation noted that Asian populations show different associations between BMI, body fat percentage, and health risk than European populations, and that the proportion at high risk of type 2 diabetes and cardiovascular disease is substantial at BMIs below the standard overweight line of 25. An Asian BMI calculator applies those lower action points instead of the global table.
For adults over 65, the mortality curve bends the other way. Winter and colleagues pooled 32 prospective cohorts covering 197,940 adults aged 65 and older. Using BMI 23.0–23.9 as the reference, mortality risk was 12% higher at BMI 21.0–21.9 and 19% higher at BMI 20.0–20.9. Being in the 25–30 band was not associated with increased mortality in this older group. A BMI of 21 at 75 does not carry the same reassurance it does at 35.
Waist circumference cuts across both adjustments. NHLBI draws the risk line at more than 35 inches for women and more than 40 inches for men: above those thresholds, heart disease and type 2 diabetes risk rises regardless of what the scale says. A 5′6″ woman at 145 lbs with a 32-inch waist and a 5′6″ woman at 130 lbs with a 37-inch waist are not in the same risk category. The tape measures where fat sits. BMI measures how much mass the body carries.
How to turn your range into a usable target
Start with your height in the table above. That band is your screening window. Then add the measurements that decide whether a point inside it is a good fit for you.
Waist first. It takes ten seconds and tells you more about visceral fat than the scale does. If your waist is under the threshold and your weight sits inside the band, you are in reasonable territory. If your waist is over the threshold and your BMI reads “healthy,” the waist is the signal worth acting on.
Body fat second, if you have access to a reliable measurement. DEXA is the reference standard; a tape-based Navy method or a BIA scale gives a rougher estimate. If your body fat is in the healthy range for your age and sex, a BMI near the top of the band is less concerning than a BMI near the bottom with high body fat.
Trend third. A weight that stays stable across seasons — same waist, same strength, same energy — tells you more than a single reading on a Tuesday morning. One reader wrote in after tracking for six months: her weight had moved less than three pounds, but her waist had dropped two inches. The scale said nothing had changed. The tape said otherwise.
Pick a target you can hold through a holiday season and a stressful month, not one you hit once and lose by spring. That is the more useful test of whether a number is right for you.
Frequently Asked Questions
What is the ideal body weight in pounds for a 5′6″ woman?
The BMI-based healthy range is 118–155 lbs. The classic formulas land between 121 lbs (Devine) and 133 lbs (Miller) — a 12-pound spread. Every formula number sits inside the healthy band. None of them is “more correct” than the band itself.
Is there a single ideal weight in pounds, or is it always a range?
For health screening, it is a range. The CDC defines healthy weight as BMI 18.5 to under 25, and that translates to a band roughly 30–40 pounds wide for most adult heights. A single number from a formula cannot account for frame, muscle, or fat distribution.
Why does my ideal weight change with age?
Because body composition and mortality risk both shift. Winter et al’s 32-cohort meta-analysis found that for adults 65 and older, BMI 21.0–21.9 carried a 12% higher mortality risk than BMI 23.0–23.9, and BMI 20.0–20.9 carried a 19% higher risk. The reference group was BMI 23.0–23.9. Relative to the standard 18.5–24.9 band:
The lowest-risk reference point was BMI 23.0–23.9.
BMI 25–30 was not linked to higher mortality in this meta-analysis.
Risk rose again above BMI 33.0.
Should Asian adults use a lower BMI range for ideal weight?
Many clinicians do. WHO’s 2004 consultation identified action points at 23.0 and 27.5 kg/m² for Asian populations because metabolic risk appears at lower BMI values. The practical lower-risk window runs roughly 18.5–22.9, rather than 18.5–24.9.
What if my BMI is healthy but my waist is over the threshold?
The waist is the stronger signal in that case. NHLBI’s thresholds are more than 35 inches for women and more than 40 inches for men. In the Romero-Corral cohort of adults with normal BMI, the highest body-fat group had a four-fold higher prevalence of metabolic syndrome (16.6% vs 4.8%), and women in that group showed a 2.2-fold increased risk for cardiovascular mortality. The BMI number alone missed it.
Sources
CDC: Adult BMI Categories — Healthy Weight 18.5–24.9 and Screening Guidance
NHLBI: Aim for a Healthy Weight — Waist Circumference Thresholds and Health Risk
This article is for informational and educational purposes only. It does not constitute medical advice or replace professional health assessment. Always consult a qualified healthcare provider regarding your individual health and weight-related goals. Individual results will vary. The BMI Calculator Blog Team maintains editorial independence and does not sell health products.
Related Articles
Ideal Body Weight Formula: Real Numbers, Why a Range Beats One Number, and Who Should Ignore It
Your Ideal Body Weight Is a Range, Not a Number: What Formulas Miss and What to Track
What Is Ideal Body Weight? Why Formulas Give Different Numbers
Last updated: October 18, 2026.