At a Glance: A height and weight chart for ages 0–5 converts raw measurements into sex-specific percentiles using WHO standards (0–2 years) and CDC standards (2–5 years). The goal is to track growth velocity and channel over time, not to hit one number. A steady percentile curve is a stronger sign of healthy growth than any single visit weight.
Growth charts work as screening aids, not pass/fail scores. They compare your child with a reference population to show whether the overall pattern stays consistent. Once you understand percentiles, well-child visits become a planning conversation instead of a number chase.
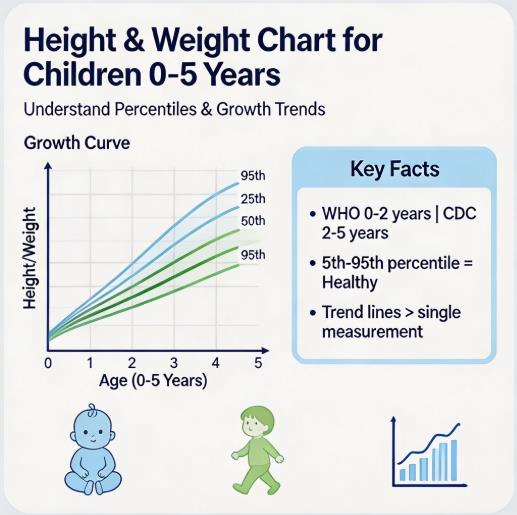
Why Growth Tracking Changes at Age 2
The first five years split into two reporting periods. From birth to 24 months, plot measurements on WHO growth standards. These curves come from a multi-country sample of healthy, breastfed infants in optimal conditions, so they describe how young children tend to grow when fed and cared for under best-practice conditions.
After the second birthday, U.S. pediatricians usually move to CDC growth charts. Those charts describe how children in the U.S. actually grew across recent survey data. The plotted metric also changes: under 2 the main screen is weight-for-length; at 2 and older it is BMI-for-age, because BMI adjusts weight for height.
A 24-month-old boy weighing 24 pounds 4 ounces with a length of 23.25 inches lands between the 25th and 50th percentiles on the WHO weight-for-length chart. On the CDC BMI-for-age chart for 24 months, the same measurements fall near the 10th percentile. Both plots can be normal. The drop happens because the standard, the age window, and the weight-vs-height metric all change at the switch. CDC training materials note that a child at a given percentile on WHO charts may receive a different percentile label on CDC charts even when the underlying growth pattern has not changed, so the trend across visits matters more than the single handoff number.
Decoding the Percentile Ranges
Misreading percentiles creates avoidable stress. The practical bands for weight screening are:
Below the 5th percentile (weight) or 2nd (height):Worth reviewing with a pediatrician. It can reflect feeding issues, illness, or simply a small familial build. A child who has sat at the 3rd since infancy and follows that line usually needs monitoring, not alarm.
5th to 85th percentile:The routine healthy range. No action is driven by the chart alone.
85th to 95th percentile (weight):Overweight screening flag. This is not a diagnosis; review meals, snacks, sleep, and active play with your provider.
Above the 95th percentile (weight):Obesity screening range. It carries longer-term health considerations and justifies a structured nutrition/activity plan through your pediatrician.
Above the 99th percentile (weight):Severe obesity screening range. It calls for regular pediatric follow-up and a fuller look at diet, activity, sleep, and family history.
For the same percentile logic applied past age 5, our guide on CDC growth charts for ages 2–20 explains how BMI tracks through school years and adolescence.
Why the Trend Line Matters More Than a Single Dot
Three or four plotted visits beat any single number. Weight shifts with illness, constipation, clothing, and time of day; height can vary with stance and measuring board technique. Clinicians therefore read the channel, not the dot.
Upward crossing:Moving from the 50th to the 85th for weight in six months, while height stays put, suggests energy intake or activity balance needs review.
Downward crossing:Sliding from the 50th to the 10th is “falling off the curve.” It can mean poor intake, absorption problems, or another medical issue that deserves timely evaluation.
Stalling:No height or weight gain for several months under age 2 is always worth a replot and a pediatrician discussion.
In anonymous logs submitted through online percentile tools, one recurring pattern involves 4-year-olds entering preschool. Parents see a small upward weight-percentile bump and assume daycare portions are too large. In many of those logs, height velocity rises in the same quarter. The weight gain is proportional to the growth spurt, so the combined BMI percentile stays flat. A single weigh-in would miss that; the multi-visit trend makes it obvious.
Normal Growth Velocity by Age (0–5 Years)
Infants and toddlers grow in episodes, not straight lines. Typical ranges from WHO and CDC references:
| Age Range | Expected Weight Gain | Expected Height Gain | Key Milestones |
|---|---|---|---|
| 0–6 months | 5–7 oz (140–200 g) per week | 0.8–1 inch (2–2.5 cm) per month | Doubles birth weight by 4–5 months |
| 6–12 months | 3–5 oz (85–140 g) per week | 0.5–0.6 inch (1.3–1.5 cm) per month | Triples birth weight by 12 months |
| 12–24 months | 3–5 lbs (1.4–2.3 kg) per year | 4–5 inches (10–13 cm) per year | Toddler appetite often dips (normal) |
| 2–5 years | 4–5 lbs (1.8–2.3 kg) per year | 2.5–3.5 inches (6–9 cm) per year | BMI-for-age becomes the main screening metric |
Those averages hide plenty of quiet weeks. A child may hold weight for two to three months, then jump in height and weight during one growth episode. That is why standardized office measurements every few months outweigh daily home scale checks.
Preterm infants: plot with corrected age from due date, not chronological age, until about 2–3 years for most growth measures.
When to Discuss Growth with a Provider
Bring the following patterns to your next well-child visit:
Weight-for-length or BMI-for-age above the 95th after age 2.
Weight-for-length below the 2nd percentile, or height below the 2nd with no short-stature family history.
Downward crossing of two or more major percentile lines from a previously stable channel.
Rapid upward weight crossing plus family history of obesity, hypertension, or diabetes.
Children with conditions such as Down syndrome or Turner syndrome use condition-specific charts and should not be read against general 0–5 percentiles.
Common Myths About Toddler Growth
Does the 10th percentile mean my child is underweight?
Fact: No. The 10th sits inside the 5th–85th healthy band. Concern appears when a child falls from a higher channel to the 10th over several visits, not when they have always tracked near the 10th and grown steadily.
Are WHO and CDC charts the same?
Fact: Different jobs. WHO 0–2 describes optimal growth in breastfed infants; CDC 2+ describes U.S. population growth. The age-2 switch often moves the printed percentile even when the child’s curve is unchanged.
Is a post-solids weight jump dangerous?
Fact: A 5–10 percentile-point rise after solids start is common. A rise above 20 points over 6–12 months, especially with reduced activity or frequent high-calorie snacks, is worth a pediatrician review.
Should I weigh my toddler daily?
Fact: Daily weights add noise and anxiety. AAP-style well-childcadence covers 12, 18, 24, 30, and 36 months, then annual checks. Periodic percentile-tool logs give a clearer trend than bathroom scales.
Frequently Asked Questions
Is my baby underweight if they're at the 10th percentile?
Not by percentile alone. The 10th is within the normal screening range. One parent shared logs where weight drifted from the 25th to the 12th over three months; height had also shifted slightly upward on its own curve. After the pediatrician replotted both metrics together, the overall channel was unchanged and no feeding problem was found. The alert sign is a sustained drop from a personal baseline, not a single low number.
What's the difference between WHO and CDC growth charts?
WHO charts cover 0–24 months and model optimal growth from healthy, breastfed infants in multiple countries. CDC charts cover 2–20 years and reflect U.S. population data. Under 2 the usual screen is weight-for-length; at 2 it switches to BMI-for-age. Because the references differ, the same child can show a lower CDC percentile at 24 months than on WHO charts even with steady growth—review the trend, not just the handoff point.
My toddler's weight percentile jumped after starting solids. Is that normal?
A small rise of 5–10 points is common as calorie density increases. Most babies also become more active and irregular with solids, so the net curve stays stable. A jump above 20 points across two visits, or upward crossing paired with less height gain, should be reviewed for portion size, sweetened drinks, and screen-time balance.
How often should my child's height and weight be measured?
Standard well-childcadence includes birth, the first week, then 1, 2, 4, 6, 9, 12, 15, 18, 24, 30, and 36 months, and annual checks after age 3. Home scales are useful only for rough trends. One parent kept a twice-yearly log of office measurements in a notebook and brought it to each visit; the pediatrician said the side-by-side plots made channel changes far easier to read than isolated walk-in weights. That every-six-months habit beats daily weighing for almost every toddler.
Can a child be tall and still have a weight problem?
Yes. Compare BMI or weight-for-length, not weight alone. A child at the 97th for height and 97th for weight may land near the 50th for BMI; a child at the 50th for height and 97th for weight may exceed the 95th BMI. The height-weight combination decides whether the weight is proportional.
Sources
This article is for education only. It is not medical advice, diagnosis, or treatment. Growth charts are screening tools; discuss any percentile drop, rapid gain, or feeding concern with your pediatrician or qualified healthcare provider.