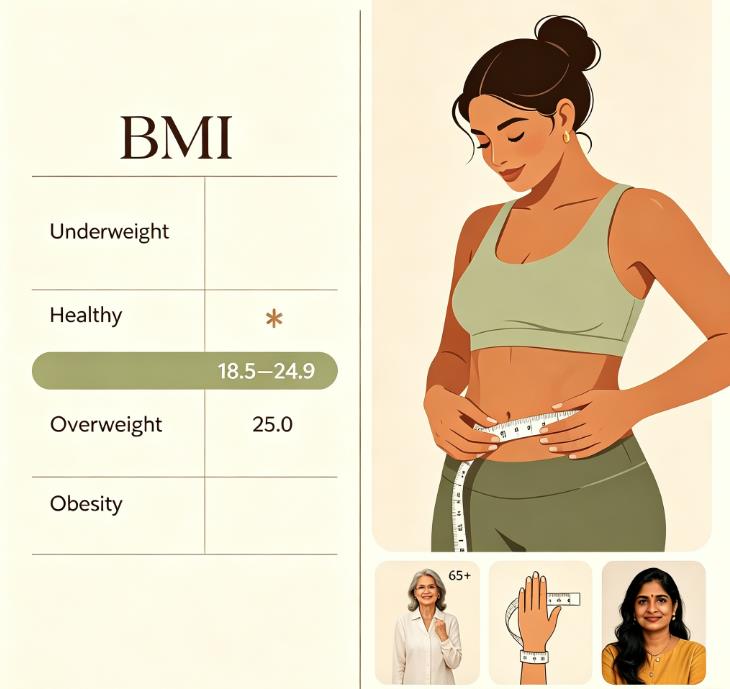
At a Glance: A BMI chart for women looks straightforward—find your height on one axis, your weight on the other, and the intersecting number lands you in a category. But what most charts don't tell you is that the standard ranges don't account for the hormonal shifts of perimenopause, the body composition changes after pregnancy, or the muscle mass of a woman who strength trains. This guide explains what a women's BMI chart actually measures, the life stages that change how you should read your number, and which two additional metrics give you a fuller picture than any chart alone.


Editorial development: BMI Calculator Blog Team. Content aligned with WHO and CDC guidelines.


A number doesn't know your story

A woman stands on her bathroom scale on a Tuesday morning. She's 45, three years into a demanding marketing director role, two years past her last regular period. She's been eating the same way, moving the same way, but her weight has crept up 12 pounds in 18 months. She pulls up a BMI chart on her phone, finds her height, slides her finger across to her weight, and lands at a number she's never seen before. The chart says "overweight." It doesn't mention perimenopause, cortisol, or the metabolic shifts that arrive without warning in midlife.

The Centers for Disease Control and Prevention (CDC) classifies BMI for adult women using the same ranges applied to men: underweight below 18.5, normal weight 18.5 to 24.9, overweight 25.0 to 29.9, and obese 30.0 and above. These categories are gender-neutral by design—the formula doesn't ask whether you're male or female before it calculates. Yet women's bodies go through hormonal and compositional shifts that men's bodies simply don't: pregnancy, postpartum recovery, perimenopause, menopause. A women's BMI chart gives you a number. It doesn't give you context. A BMI calculator produces that number in seconds—but reading it well means understanding the life stage you're in.

As the American College of Obstetricians and Gynecologists (ACOG) states in its committee opinion on health assessment during midlife, evaluating a woman's health requires looking beyond BMI to include abdominal obesity and metabolic risk factors—a number alone never tells the full story. A chart opens the conversation. It doesn't close it.

What a standard BMI chart for women actually shows—and what it misses

The visual is familiar. Heights down the left side, weights across the top, colored bands marking the categories. At a glance, you get a classification. But glance again. A 5'5" woman weighing 150 pounds has a BMI of 25.0—the exact threshold of "overweight." If she just finished a lunch of sushi and miso soup, hydration alone could push the scale enough to cross that line. If she's been strength training for two years, her body fat percentage might be in the athletic range while the chart labels her overweight. If she's 60 and has lost muscle mass without losing weight, the chart tells her she's the same as she was at 30—even though her body composition has shifted significantly.

A 2023 CDC analysis found that roughly 24% of normal-weight American adults have metabolic abnormalities linked to high body fat. The reverse is also true. A 2018 meta-analysis published in the International Journal of Obesity (Barry, V.W. et al. 2018; 42(4): 749-757) reviewed data from over 40,000 women and found that cardiorespiratory fitness was a stronger predictor of all-cause mortality than BMI category alone. A woman with an "overweight" BMI who is physically active may have a lower mortality risk than a woman with a "normal" BMI who is sedentary. The chart sees neither of these details.

BMI Chart for Women Explaining Limitations for Menopause Postpartum and Strength Training Women

Life stages that change how you should read your number

During pregnancy and the year after

BMI charts are not designed for pregnant bodies. Weight gain during pregnancy is expected, healthy, and highly variable between individuals. ACOG recommends using pre-pregnancy BMI to determine appropriate weight gain ranges—not to track BMI during pregnancy itself. After delivery, the postpartum year brings its own metabolic shifts: breastfeeding burns additional calories, sleep disruption elevates cortisol, and the slow process of rebuilding muscle mass after pregnancy takes months longer than most women expect. A women's BMI chart will show your postpartum number. It won't tell you that muscle loss during bed rest or reduced activity after delivery can mean your body fat percentage is higher than someone else at the exact same BMI. For postpartum women, a body fat calculator that uses circumference measurements often provides a more meaningful picture than BMI alone.

Perimenopause and menopause

The hormonal transition that begins for most women in their 40s changes the rules. Declining estrogen shifts where the body stores fat—away from hips and thighs, toward the abdomen—even if total weight stays the same. A woman can maintain a stable BMI through perimenopause while her visceral fat increases significantly, a change that the chart completely misses. The NIH identifies high-risk waist measurements as above 35 inches for women regardless of BMI, and this threshold becomes especially important during the menopausal transition. A 2022 study in Menopause (Greendale, G.A. et al. 2022; 29(5): 523-530) found that waist circumference increased an average of 2.4 inches across the menopausal transition even among women whose weight remained stable. The BMI chart saw no change. The metabolic reality shifted significantly.

Strength training and muscle mass

Women who lift weights regularly—whether barbells, kettlebells, or bodyweight—often find themselves misclassified by BMI charts. A pound of muscle and a pound of fat weigh exactly the same, but muscle is denser and takes up less space. A woman who strength trains four times a week may wear a smaller clothing size than she did before she started training, while her weight stays the same or even increases slightly, pushing her BMI higher. The chart labels this as a step toward worse health. In reality, her body composition has shifted in a metabolically protective direction. For active women, an athlete BMI calculator provides helpful context, and combining BMI with body fat percentage and waist circumference gives a more complete assessment.

Consider a story that plays out in gyms and clinics across the country

A 38-year-old nurse practitioner in Portland, Oregon, has been strength training three times a week for the past four years. She's 5'6" and 160 pounds—BMI of 25.8, solidly in the "overweight" category. At her annual physical, a new medical assistant reads her BMI off the chart and makes a note flagging her as overweight. Nobody measures her waist. Nobody asks about her exercise habits. The chart has spoken.

What the chart doesn't show: her waist measures 31 inches—below the NIH threshold of 35 inches for women. Her body fat percentage, checked annually by DEXA, sits at 23 percent—healthy for a woman her age. Her fasting glucose is 84 mg/dL. Her blood pressure runs 112/70. She deadlifts 265 pounds. The BMI chart, the most widely used screening tool in medicine, labels her as overweight. Her blood work, her waist circumference, and her body fat percentage tell a completely different story. She now starts every appointment by asking her provider to note her waist measurement alongside her BMI—a small habit that changes the entire conversation about her health.

Three states away, a 52-year-old woman in Nashville, Tennessee is going through menopause. Her BMI is 23.5—right in the middle of "normal." Her chart looks reassuring. But her waist has expanded to 36 inches over the past three years, crossing the NIH risk threshold, and her fasting glucose is creeping up. The chart tells her she's fine. Her waist circumference tells her she's not. Both stories are true, and both illustrate the same point: the women's BMI chart is a starting point that needs context, especially during the life stages that change women's bodies the most.

As ACOG emphasizes in its committee opinion on midlife health assessment, evaluating a woman's health requires looking beyond BMI to include abdominal obesity and metabolic risk factors—the number opens the conversation, but waist circumference, blood work, and body composition complete it.

Two numbers that tell you more than a BMI chart alone

If you want a fuller picture of your health than any single chart can provide, two additional measurements matter most.

Waist circumference

Where you carry weight matters more than how much you weigh. Visceral fat—the kind packed around your internal organs—is metabolically active in ways that subcutaneous fat is not, releasing inflammatory compounds linked to heart disease and diabetes. The NIH threshold for women is 35 inches measured at the navel. This threshold holds regardless of your BMI. A 2022 study in Menopause (Greendale, G.A. et al. 2022; 29(5): 523-530) tracking women across the menopausal transition found that waist circumference increased an average of 2.4 inches even among women whose weight stayed the same—a shift the BMI chart completely missed.

Body fat percentage

BMI treats every pound the same way. A pound of muscle and a pound of fat weigh identically, but affect metabolism in opposite directions. For adult women aged 18 to 39, healthy body fat ranges from roughly 21% to 24%; for women 40 and older, a slightly higher 23% to 28% is considered metabolically healthy, aligning with ACE and CDC age-adjusted body composition benchmarks. The American Council on Exercise publishes validated norms that account for these differences. A body fat calculator using multiple circumference measurements provides a far more individualized view than a chart that only knows your height and weight.

How BMI limitations shift across life stages

Female Life StageStandard BMI LimitationMust-Pair MetricHealthy Reference Standard
PostpartumMuscle loss and cortisol elevation skew resultsWaist + Body Fat %Waist under 35 inches; Body fat 21–28%
Perimenopause / MenopauseVisceral fat gain without weight changeWaist circumferenceStrictly under 35 inches (NIH female threshold)
Strength-Training WomenHigh muscle mass inflates BMIBody fat % + waistBMI 25–28 may still be metabolically healthy
Young Adult (18–39)Relatively accurate baselineBasic BMI + routine checkup18.5–24.9 standard range

How to use a women's BMI chart without letting it define you

The BMI chart is a screening tool. Nothing more. It tells you where you fall in a population distribution. It doesn't see your exercise habits, your hormonal stage, your muscle mass, or where you carry your weight. Here's how to use it wisely:

  • Check your BMI once or twice a year as a rough reference point. Don't treat it as a weekly or monthly metric that needs tracking.

  • Measure your waist circumference at the same time. If your waist is under 35 inches and your BMI is overweight, muscle—not fat—may be the reason.

  • Consider your life stage. If you're postpartum, in perimenopause, or postmenopausal, your BMI number needs more context, not less. Waist circumference and body fat percentage become more important during these transitions.

  • If you strength train, treat your BMI category with healthy skepticism. It was not designed for bodies with above-average muscle mass.

Your 5-Minute Beyond-the-Chart Check

  • Step 1: Note your height and weight. Calculate your BMI. Write down the category.

  • Step 2: Measure your waist at the navel. Compare to the NIH threshold of 35 inches for women.

  • Step 3: If the two numbers disagree—BMI says one thing, waist says another—check your body fat percentage for the tiebreaker.

Common myths about BMI charts for women

  • Myth: A "normal" BMI means you're metabolically healthy. Fact: Roughly 24% of normal-weight American adults have metabolic abnormalities. Waist circumference and body fat percentage often reveal risks that BMI alone misses—especially during perimenopause when visceral fat increases without weight gain.

  • Myth: An "overweight" BMI means you're unhealthy. Fact: If your excess weight is muscle, your waist is under 35 inches, and your metabolic markers are normal, an overweight BMI may not indicate elevated risk. Cardiorespiratory fitness independently predicts health outcomes regardless of BMI.

  • Myth: The BMI chart works the same for women at every age. Fact: Pregnancy, postpartum recovery, perimenopause, and menopause all change how BMI should be interpreted. A 52-year-old woman and a 22-year-old woman with the same BMI may have very different body compositions and health profiles.

  • Myth: If your BMI is normal, you don't need to check anything else. Fact: A 2022 study in Menopause (Greendale, G.A. et al. 2022; 29(5): 523-530) found that women in the menopausal transition can gain significant visceral fat without changing their BMI. Waist circumference catches shifts that the chart misses.


Content Integrity Review: The health information and classification standards in this article have been checked for alignment with current CDC BMI guidelines and ACOG clinical guidance on women's health assessment. Individual medical advice should always be obtained from your personal healthcare provider.


Developed using national health statistics, WHO guidelines, and CDC recommendations for adults in the U.S. All advice is adapted to reflect the hormonal, body composition, and life stage considerations specific to women's health.


Sources


Frequently Asked Questions

Is there a separate BMI chart for women?
No. The CDC and WHO use the same BMI categories for both women and men—underweight below 18.5, normal 18.5 to 24.9, overweight 25.0 to 29.9, obese 30.0 and above. However, interpretation differs because women naturally carry a higher body fat percentage than men at the same BMI, and women's bodies go through hormonal and body composition changes—pregnancy, perimenopause, menopause—that a standard chart doesn't account for. This is why pairing BMI with waist circumference and body fat percentage is especially important for women.

Does menopause change what BMI is considered healthy?
The CDC and WHO don't adjust the BMI categories for menopause, but the interpretation changes. During the menopausal transition, estrogen declines, and fat deposition shifts toward the abdomen even if total weight stays the same. A woman can maintain a stable BMI through menopause while her visceral fat increases significantly, raising her metabolic risk. Waist circumference—keeping it under 35 inches—becomes a more important health metric during and after this transition than BMI alone.

Should pregnant women use a BMI chart to track weight?
No. BMI charts are not designed for use during pregnancy. ACOG recommends using pre-pregnancy BMI to determine appropriate gestational weight gain ranges, but BMI tracking during pregnancy itself is not clinically meaningful. Weight gain during pregnancy is expected and varies significantly between individuals based on pre-pregnancy BMI, activity level, and individual health factors.

How often should I check my BMI?
Once or twice a year is sufficient for most women, or whenever your weight changes by 10 pounds or more. What's more valuable is tracking your waist circumference and noticing how your clothes fit over time—these reflect body composition shifts that the BMI formula can't detect, especially during hormonal transitions.


Copyright and Content Protection | BMI Calculator Blog. All educational content in this article is the exclusive property of BMI Calculator Blog. All advice, tips, and materials published on the blog are created for informational and educational purposes only for readers in the United States. Unauthorized copying, reproduction, distribution, or commercial use of this text in whole or in part is prohibited without prior written consent from the site administrator. Medical Disclaimer: The content of this article is for informational purposes only and does not replace professional medical advice, diagnosis, or treatment. Always seek the advice of a qualified physician or other health experts with any questions regarding medical conditions or health goals.