Quick Summary: A body fat percentage chart for men splits male body composition into five bands: essential fat 2–5%, athletic 6–13%, healthy 14–17%, overweight 18–24%, and obesity 25% and up. Men carry less essential fat than women, so every number sits lower than on the female chart. The healthy band also climbs with age — 11–17% in your 20s becomes 16–23% past 60.
Five bands, not one target. These are American Council on Exercise (ACE) reference ranges for adult men, and our own body fat tool is calibrated to the same cutoffs.
14–17% is the band worth aiming at. It carries the lowest all-cause mortality in population studies, and unlike the athletic range, most men can actually hold it year-round.
Male and female charts are not interchangeable. Essential fat bottoms out at 2–5% for men versus 10–13% for women, which drags every category down.
BMI stops working once you lift. A 5'10" man at 210 lbs reads "obese" on BMI and "athletic" on body fat. Same body, opposite verdicts.
The tape measure settles arguments. Under 37 inches is the WHO line for increased risk, and past 40 inches risk climbs substantially whatever your percentage says.
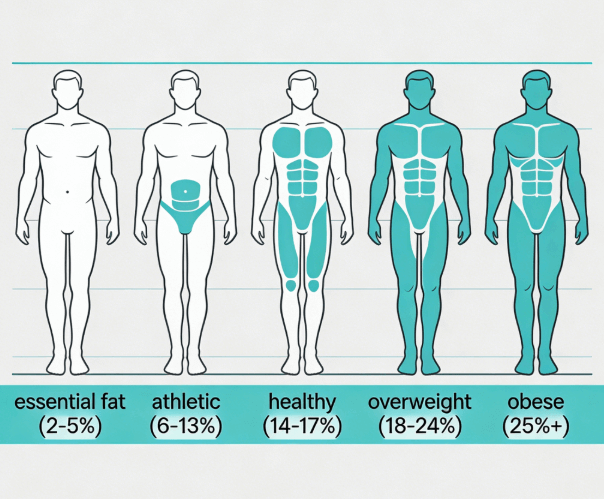
The Body Fat Percentage Chart for Men
A body fat percentage chart for men divides male body composition into five bands, based on how much of your total weight is fat tissue rather than muscle, bone, water, or organs.
| Category | Body fat % | What it looks like |
|---|---|---|
| Essential fat | 2–5% | Muscle striation everywhere, visible veins in arms and legs, facial leanness. This is the biological floor, not a goal. |
| Athletic | 6–13% | Abs clearly visible at the low end, slightly softer at 13%. Clear definition across chest, shoulders, and arms. |
| Healthy | 14–17% | Some abdominal definition — often a four-pack rather than a six-pack. Muscular but not sharply cut. Waist usually under 37 inches. |
| Overweight | 18–24% | No abdominal definition. Noticeable softness around the midsection, with fullness appearing in the face and neck. |
| Obesity | 25% and up | Waist typically past 40 inches. Fat accumulation visible across the torso, face, and limbs. |
Source: ACE reference ranges for adult men. Treat them as screening bands, not diagnostic labels — they place you against other men, not on a health verdict.
What Each Band Means for Your Health
At 2–5%, you are looking at essential fat — the biological floor. Fat at this level cushions organs, insulates nerve fibers, and maintains cell membrane integrity. Dropping below 3% is associated with testosterone suppression, impaired immune function, and reduced bone mineral density. Competitive bodybuilders touch this range briefly, and under close supervision. It is a survival minimum, not a target.
Most men who train seriously sit somewhere in the athletic band, 6–13%. The lower end demands disciplined nutrition and consistent training. The upper end is more forgiving — reachable for men training hard four or five days a week without counting every calorie. A reality check, though: lean is not the same as healthy. A man at 8% who smokes, drinks heavily, and sleeps four hours can carry worse internal markers than a man at 18% who runs and prioritizes rest.
Ask men who have spent real time lean where they felt best, and the answers cluster in a narrow window — around 11–12%. Lean enough to look the part, with enough energy left for work and family. That is the tradeoff most active men end up choosing, and it is worth naming: holding single digits for a photo shoot is a completely different project from holding a physique you can live in for a decade.
The 14–17% band is where the mortality data looks best. It carries the strongest association with low all-cause mortality in epidemiological studies, and waist circumference generally stays below 37 inches (94 cm), the WHO threshold for increased metabolic risk. It is also the most livable range: restaurant meals, a missed workout, and the occasional drink do not push you into the next band.
Things start shifting at 18–24%. Here fat begins outpacing lean mass in ways that show up in metabolic markers, with waist typically running between 37 and 40 inches (94–102 cm).
The location matters more than the total. The NHLBI notes that abdominal fat — the kind that pushes the waist measurement up — tracks more strongly with insulin resistance and cardiovascular strain than fat stored at the hips and thighs. Adding roughly 150 minutes of weekly activity, about a brisk 20-minute walk after dinner, can shrink waist circumference measurably within 8–12 weeks even before any dietary change.
Past 25%, the risk picture changes. Above 25% combined with a waist beyond 40 inches (102 cm), population-level risk rises for type 2 diabetes, hypertension, and cardiovascular disease. The CDC is explicit that this is a screening threshold, not a diagnosis — individual risk still depends on genetics, activity, and where you store fat.
The single most effective starting move is unglamorous: cut sugar-sweetened drinks. A 12-ounce soda holds roughly 150 calories and 39 grams of sugar, so dropping two a day opens a 300-calorie daily deficit without changing anything else.
Why BMI Gets Men Wrong
BMI does not know whether your weight came from bench presses or burgers. Body fat percentage separates the two, and for men who lift, that distinction is the whole story.
Picture a 5'10" (178 cm) man at 210 lbs (95 kg). His BMI is 30.1 — obese by the standard chart. But he squats 405, deadlifts 500, carries 12% body fat, and has a 33-inch waist. The BMI chart calls him unhealthy. The body fat chart puts him in the athletic band with a low risk profile. Which reading makes more sense?
ACE estimates BMI misclassifies roughly 10–15% of men, mostly those carrying above-average muscle. Start with a Gender Adjusted BMI Calculator to get your index, then let body composition finish the conversation. For a side-by-side look at what each tool actually measures, see our guide on body fat percentage vs BMI.
How Age Shifts Your Number
A healthy body fat percentage at 25 is not the same number at 55. Muscle mass declines roughly 3–8% per decade after 30, so body fat creeps upward even when the scale holds steady.
| Age group | Healthy body fat range | What to focus on |
|---|---|---|
| 20–29 | 11–17% | Peak testosterone. Building muscle is easiest here — lock in habits that carry forward. |
| 30–39 | 12–18% | Gradual muscle loss begins. Two strength sessions a week and higher protein start to matter. |
| 40–49 | 14–20% | Testosterone declines about 1% a year. Abdominal fat can rise without weight gain — track your waist. |
| 50–59 | 15–21% | Muscle preservation becomes the priority. Protein near 1.2–1.6 g per kg under professional guidance, resistance work 2–3 times weekly. |
| 60+ | 16–23% | Some extra fat may protect against frailty. Shift focus to strength, balance, and eating enough. |
An upward drift in the numbers is not permission to stop paying attention.
A 60-year-old at 21% who lifts and walks daily is likely in better functional health than a sedentary 30-year-old at the same figure.
How to Measure Your Body Fat Percentage
The U.S. Navy method is the most practical route if you want to do the math yourself. A soft tape measure and about three minutes is all it takes.
Waist: measured at the navel, not the narrowest point — that is the key difference from the female protocol. Wrap the tape snugly without compressing skin, measure after a normal exhale, and do not suck in.
Neck: just below the Adam's apple, tape angled slightly downward at the front, head straight. This figure lets the formula subtract lean upper-body mass.
Height: barefoot, standing straight against a wall. Pair it with a morning weight taken after using the bathroom, on a hard floor, without heavy clothing.
Our body fat calculator takes a slightly different route to the same place — it runs an enhanced Deurenberg equation that folds in BMI, age, sex, and waist-to-height ratio, and reports an estimate with a ±2% margin. Different inputs, same idea: turn a few measurements into a composition estimate. Neither approach matches a DEXA scan to the decimal, but both are consistent enough to track change over time, which is the part that matters.
Where does each land? The World Health Organization sets 37 inches (94 cm) as the threshold for increased metabolic risk in men and 40 inches (102 cm) for substantially increased risk — two steps, not one line, which is why a waist of 38 is worth watching rather than ignoring. These thresholds were developed primarily from Western population data, so men of Asian descent may warrant screening at smaller waist sizes. The CDC frames the upper line the same way, recommending men stay under 40 inches.
For skinfold calipers, BIA scales, and how each compares, read our full guide to measuring body fat at home.
Frequently Asked Questions About Men's Body Fat Percentage
What body fat percentage shows abs?
Under 12% is the general line, and closer to 10% or lower for a clearly defined six-pack. Genetics decide exactly when definition appears — some men show abs at 14%, others need single digits. Waist circumference is the more reliable progress marker, since under 37 inches (94 cm) means abdominal fat is trending the right way.
Can a muscular man have an overweight BMI but healthy body fat?
Yes — and it is far more common than most people assume. A 5'8" (173 cm) man at 190 lbs (86 kg) with 14% body fat has a BMI of 28.9, which reads as overweight by CDC standards, while his body fat percentage sits in the healthy band. BMI sees height and weight only, so it cannot tell what the weight is made of.
How fast can men lose body fat?
About 1–2% per month, assuming you are also lifting. That pace assumes a 300–500 daily calorie deficit plus resistance work to protect muscle. Faster loss tends to cannibalize lean tissue — losing 3 lbs a week usually means a meaningful share is muscle, which slows your metabolism and makes staying lean harder.
What waist measurement signals too much belly fat for men?
The WHO thresholds are 37 inches (94 cm) for increased risk and 40 inches (102 cm) for substantially increased risk, with those cutoffs drawn mainly from Western population data. Waist size earns its place because it tracks visceral fat — the metabolically active fat packed around your organs that neither BMI nor body fat percentage captures directly.
Does body fat percentage matter more than weight?
Yes — with a catch: the percentage is only as good as the method behind it. Two men can both weigh 200 lbs (91 kg) — one at 30% body fat, one at 12% — and sit in completely different health categories. Weight says nothing about composition. Body fat percentage does, provided you measure it consistently.
Is 15% body fat good for a man over 40 — and can you stop the age drift?
Yes, 15% is solid. The healthy range for men aged 40–49 is 14–20%, and for 50–59 it is 15–21%, so 15% sits in the fitness band at either end of middle age. Halting the drift takes different work than losing fat does: two or three resistance sessions a week, protein near 1.2–1.6 g per kg under professional guidance, and daily walking. The National Institute on Aging points to resistance training as the core intervention for preserving muscle as you get older — steady habits do more here than short aggressive diets.
Sources
CDC: Adult BMI Categories — Classification, Use, and Screening Limitations
NHLBI: Aim for a Healthy Weight — Body Composition and Health Risk
CDC: Overweight and Obesity — Causes, Consequences, and Health Outcomes
National Institute on Aging: Exercise and Physical Activity for Older Adults
Related Articles
Body Fat by Age for Men: What's Healthy, What Changes, and How to Measure Real Progress
What Body Fat Percentage for Abs? Men vs Women — The Real Numbers and How to Get There
Healthy Body Fat Percentage for Athletes: Sport-Specific Ranges and How to Measure Accurately
BMI Calculator Blog. This content is provided for educational and informational purposes only. We encourage sharing with proper attribution to our site. Unauthorized commercial use is prohibited. Medical Disclaimer: The content of this article is for informational purposes only and does not replace professional medical advice, diagnosis, or treatment. Always seek the advice of a qualified physician or other health experts with any questions regarding medical conditions or health goals. Individual results will vary. The BMI Calculator Blog Team maintains editorial independence and does not sell health products.