Quick Summary: A body fat percentage chart for women breaks body fat into five categories — from essential fat to obesity — based on ACE guidelines. Healthy ranges shift upward with age due to hormonal changes. BMI cannot tell fat from muscle, so body fat percentage plus waist measurement gives a fuller picture of female metabolic health.
A body fat percentage chart for women separates total body weight into lean mass and fat mass across five categories: essential, athletic, healthy, overweight, and obesity.
Healthy body fat ranges rise with age — from 18–24% in your 20s to 23–29% after 60 — reflecting natural hormonal and muscle changes.
BMI uses only height and weight. Two women with identical BMIs can have completely different body fat percentages and health profiles.
The U.S. Navy method uses waist, neck, height, and weight to estimate body fat at home. For clinical precision, DEXA remains the gold standard.
Waist circumference above 35 inches (88 cm) is an independent risk marker — even when total body fat falls in the acceptable range.
A body fat percentage chart for women is a reference tool that breaks down body fat levels into five categories based on the percentage of total body weight that comes from fat tissue, not muscle, bone, or water. Unlike a scale or a BMI number, this chart tells you your body composition: how much of you is lean mass and how much is fat.
That distinction matters for women in particular because female bodies require more essential fat than male bodies for hormonal function, menstrual cycle regulation, and reproductive health. The key insight? Two women can weigh the exact same, have the exact same BMI, and yet have completely different body fat percentages — and completely different health profiles. This guide helps you figure out where you land and what that actually means for your body.
Women's Body Fat Percentage Chart
| Category | Body Fat % | What It Looks Like |
|---|---|---|
| Essential Fat | 10–13% | Visible muscle definition throughout. Veins visible. Breasts and hips have minimal fat. This is the baseline needed for hormone production — going lower risks menstrual cycle disruption. |
| Athletic | 14–20% | Some muscle definition in shoulders and arms. Abs may be visible but not sharply defined. This range is common in women who train regularly. Many active women report feeling strongest and most energetic in the upper half of this range, though individual preferences vary. |
| Healthy | 21–24% | Soft curves but no rolls when standing. Waist is visible from the front. This is where most active, balanced-lifestyle women land. |
| Overweight | 25–31% | Less muscle definition. Fat accumulation may be noticeable around hips, thighs, or abdomen. Waist circumference begins to increase measurably. |
| Obesity | 32%+ | Higher body fat that may impact metabolic health markers. Waist circumference typically exceeds 35 inches (88 cm). |
Why Body Fat Percentage Tells You What BMI Cannot
What this means: BMI uses only height and weight. Body fat percentage separates fat from lean tissue. For women, this distinction changes everything — two women with the same BMI can have completely different body compositions and health profiles.
BMI calculates weight relative to height. It does not know if that weight comes from muscle, bone, water, or fat. This blind spot hits women harder than men because women naturally carry more essential fat and less muscle mass at any given height and weight. BMI alone can be a lousy health gauge if you are a woman who lifts weights or has a naturally athletic build.
Consider this real-world comparison that illustrates the gap:
| Woman A | Woman B |
|---|---|
| Height: 5'5" (165 cm) | Height: 5'5" (165 cm) |
| Weight: 150 lbs (68 kg) | Weight: 150 lbs (68 kg) |
| BMI: 25.0 — "overweight" | BMI: 25.0 — "overweight" |
| Body fat: 19% — athletic range | Body fat: 29% — overweight range |
| Strength trains 4x/week | Sedentary, minimal exercise |
Same height. Same weight. Same BMI. One is in the athletic range with low health risk. The other carries 10 percentage points more body fat — a difference BMI completely misses. The American Council on Exercise states that body fat percentage is a better predictor of health risk than BMI for individuals, especially women. For a full comparison of these two metrics, see our guide on body fat percentage vs BMI.
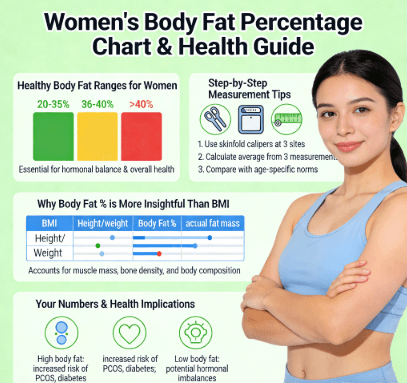
What Each Category Means for Your Health
Numbers on a chart only help if you understand what they mean. Here is what each range signals — and what you might notice in your own body.
Essential Fat: 10–13%
This is the minimum fat your body requires for basic physiological function. Fat in this range supports hormone production — particularly estrogen — and protects your organs. Dropping below this level is associated with amenorrhea (loss of menstrual periods), decreased bone density, and compromised immune function. This is not a target range for most women. It is a biological floor.
Athletic: 14–20%
Women in this range typically engage in structured training 4–6 days per week, combining strength work with cardio. Muscle definition is visible in the shoulders, arms, and legs. This range is achievable for many women with consistent training and adequate nutrition, but it requires deliberate effort — it is not where most bodies naturally settle. Many women in this range notice sleep quality can suffer if they ramp up training volume too quickly week over week. Those who sustain this level usually have a solid routine they actually enjoy, not one they are forcing themselves through.
Healthy: 21–24%
This is the range associated with the lowest all-cause mortality risk for adult women, based on epidemiological data. It reflects a lifestyle that includes regular movement and balanced eating without extreme restriction or excessive training. Most women who walk regularly, eat a mixed diet of whole and processed foods, and stay generally active land here. This range supports metabolic health, hormone function, and energy levels without requiring gym-level discipline.
Overweight: 25–31%
In this range, fat mass starts to outpace lean tissue. Over time, this can shift key metabolic health markers. The National Heart, Lung, and Blood Institute notes that excess body fat — particularly when stored around the abdomen — increases risk for high blood pressure, insulin resistance, and elevated cholesterol. Risk depends on fat distribution, activity level, and genetics, not just the percentage alone.
Obesity: 32%+
This range is associated with elevated risk for weight-related conditions including type 2 diabetes, cardiovascular disease, and joint stress. The CDC recommends that individuals in this range consult a healthcare provider for a comprehensive metabolic assessment. Waist circumference above 35 inches (88 cm) combined with body fat in this range further increases cardiometabolic risk.
How Age Shifts the Body Fat Percentage Chart for Women
Here's what matters: Body fat naturally increases with age — approximately 0.5–1% per decade after age 30 — due to hormonal shifts and gradual muscle loss. A healthy body fat percentage at 25 is not the same as a healthy percentage at 55.
The chart below shows how the healthy range shifts across age groups, based on data from the National Academy of Sports Medicine and large cohort studies:
| Age Group | Healthy Body Fat Range | What Changes |
|---|---|---|
| 20–29 | 18–24% | Peak muscle mass and metabolic rate. Lower end of the healthy range is easier to maintain. |
| 30–39 | 19–25% | Muscle mass begins gradual decline of 3–8% per decade if not actively preserved through strength training. |
| 40–49 | 21–27% | Perimenopause brings hormonal shifts that can increase fat storage, particularly around the abdomen. |
| 50–59 | 22–28% | Menopause reduces estrogen, which shifts fat distribution toward visceral storage. Muscle loss accelerates. |
| 60+ | 23–29% | Some extra body fat may be protective against frailty. Focus shifts to preserving muscle through protein intake and resistance exercise. |
This does not mean ignoring body composition changes. A 55-year-old woman with 27% body fat may be metabolically healthier than a 25-year-old with the same percentage, because some age-related fat gain is expected. What matters is whether your percentage stays within the appropriate range for your age and whether your waist circumference remains below 35 inches (88 cm).
How to Check Your Body Fat Percentage at Home
The bottom line: You need three measurements — height, weight, and waist circumference — plus a validated calculator. One measurement alone will not give you an accurate reading.
The U.S. Navy method is one of the most widely used and validated at-home estimation techniques. It uses waist circumference along with height, weight, and neck circumference to calculate body fat percentage. Here is how to take the measurements correctly:
Waist: Measured at the belly button level for women — not the narrowest point. Wrap a soft tape measure around your torso. The tape should touch your skin without compressing it. Breathe out normally before reading the number. Do not suck in your stomach. Repeat twice and average the results.
Neck: Measured just below the larynx (Adam's apple area), with the tape angled slightly downward at the front. Keep your head straight. The tape should be snug but not tight. This measurement is used in the Navy formula to subtract lean upper-body mass from the waist measurement.
Height and weight: Barefoot height against a wall, measured with a metal tape. Morning weight after bathroom, no heavy clothing, on a hard floor.
Enter all four numbers into a body fat calculator that uses the U.S. Navy method. The formula applies a gender-adjusted equation to estimate your body fat percentage. It is not as precise as a DEXA scan — the clinical gold standard — but it is accurate enough to track changes over time if you measure under the same conditions each time.
For more measurement techniques beyond the Navy method — including skinfold calipers and bioelectrical impedance — see our step-by-step guide on how to measure body fat percentage at home.
Frequently Asked Questions About Women's Body Fat Percentage
What body fat percentage is associated with the healthiest appearance?
✅ Quick answer: Research on perceived body composition suggests that a body fat percentage in the healthy range (21–24%) with a waist-to-hip ratio of roughly 0.7 tends to be rated most favorably across cultures. More importantly, the range associated with the best long-term health outcomes for adult women is 21–24%.
Can I have a healthy BMI but still carry too much body fat?
✅ Quick answer: Yes. This condition is sometimes called normal weight obesity. Research suggests that roughly 20–30% of adults with a BMI in the healthy range (18.5–24.9) have body fat percentages above 30%. A body fat measurement catches what BMI misses — which is why pairing both metrics gives the most complete picture.
How fast can I realistically lower my body fat percentage?
✅ Quick answer: A safe, sustainable rate is about 0.5–1% body fat lost per month, assuming a consistent calorie deficit of 300–500 calories per day combined with strength training to preserve muscle. Losing faster than this usually means losing muscle alongside fat, which slows your metabolism and makes it harder to maintain results.
Where on my waist should I measure?
✅ Quick answer: At your belly button. This is the standard for the U.S. Navy body fat formula for women. For men, the measurement is taken at the narrowest point above the navel. Measuring at the wrong spot can shift your estimated body fat by 2–3 percentage points.
Do I need a different chart if I am over 50?
✅ Quick answer: Yes. The healthy body fat range for women shifts upward with age — from 21–24% in your 20s to 22–28% in your 50s. This shift reflects hormonal changes and natural muscle loss. The chart in this article includes age-adjusted ranges you can reference.
Is 25% body fat too high for a woman?
✅ Quick answer: No. A body fat percentage of 25% falls into the overweight category on the ACE chart, but it is only 1 percentage point above the healthy range (21–24%). For women over 40, this number is well within the age-adjusted healthy range. Waist circumference and overall activity level matter just as much as the percentage alone.
Sources
American Council on Exercise: Body Fat Percentage Guidelines for Women
National Academy of Sports Medicine: Age-Adjusted Body-Composition Reference Ranges
NHLBI: Aim for a Healthy Weight — Body Composition and Health Risk
This educational content is for informational purposes only and does not replace professional medical advice. Always consult a qualified healthcare provider for personal body composition assessment and health guidance.