Quick Summary: Body fat by age: the healthy range climbs roughly 3–5 percentage points per decade after 30, because muscle fades and fat quietly takes its place. Men move from 14–17% in their 20s toward 18–24% by midlife. Women move from 21–24% toward 21–28%. Your waist tells you more than either number does.
The range moves up, not the goalpost. A healthy body fat percentage at 55 is not the same number as at 25. Roughly 3–5 points higher is normal, not failure.
Muscle loss drives it, not overeating. Adults lose about 3–8% of muscle per decade after 30, and the rate speeds up after 60. Fat fills the gap the muscle leaves.
Your waist outranks your percentage. Above 40 inches for men or 35 inches for women, metabolic risk climbs regardless of how lean you look.
Two resistance sessions a week changes the trajectory. It is the single most reliable counter to age-related muscle loss, and it works in your 70s.
BMI misses all of this. It cannot tell muscle from fat, which is exactly the distinction that matters once you pass 40.
What Is a Healthy Body Fat Percentage by Age?
A healthy body fat percentage is the share of your total weight made up of fat tissue — and the number that counts as healthy rises as you get older. That last part is where most charts go wrong, because they were built on young adults and then applied to everyone.
The American Council on Exercise (ACE) publishes the most widely used body fat categories. They are screening bands, not medical verdicts, but they give you a place to start:
| Category | Men | Women |
|---|---|---|
| Essential fat | 2–5% | 10–13% |
| Athletic | 6–13% | 14–20% |
| Fitness | 14–17% | 21–24% |
| Acceptable | 18–24% | 25–31% |
| Obesity | 25% and above | 32% and above |
Notice what the table does not do: it never mentions age. That is its biggest limitation, and it is why a 55-year-old reading it as literally as a 25-year-old ends up chasing a number that stopped being realistic somewhere around 40.
How the Healthy Range Shifts by Life Stage
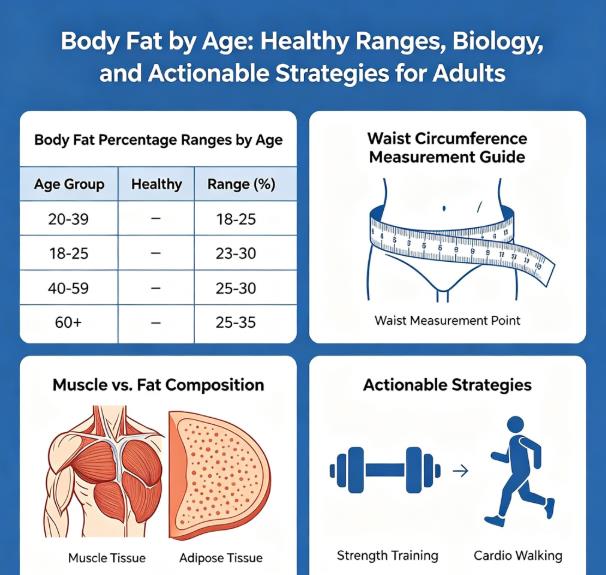
So what does change look like? Roughly 3–5 percentage points per decade, starting in your 30s.
| Life stage | Men | Women | What is driving it |
|---|---|---|---|
| 20s–30s | 14–17% | 21–24% | Peak muscle mass. Ranges sit at their lowest and are the easiest to hold. |
| 40s–50s | 14–20% | 21–28% | Muscle loss begins in earnest. Hormones start redirecting where fat lands. |
| 60+ | 16–24% | 25–31% | Loss accelerates and some reserve protects against frailty. Waist matters more than the total. |
The decade split extends those ACE categories by age. It reflects how body composition actually tracks in population data rather than a separate official standard. Note that the higher end for adults over 60 is not an obesity threshold — it allows for the fat reserve that helps protect against frailty. Past about 25% for men or 32% for women, the ACE obesity cutoffs still apply.
Two things are worth pulling out. First, the ranges widen rather than simply climb — a 50-year-old has more room than a 25-year-old, not a higher bar to clear. Second, holding the same percentage from 35 to 55 actually means you are gaining ground on your peers.
Want the decade-by-decade detail for one sex? A body fat percentage chart for men breaks the male numbers down further, and the body fat percentage chart for women does the same for women.
Why Fat Creeps Up as Muscle Fades
This is not a story about eating more. Three measurable processes do the work.
Muscle loss, or sarcopenia. From around 30, adults lose roughly 3–8% of muscle per decade, and the pace picks up after 60. Muscle is expensive tissue to maintain — it burns calories at rest. Lose it and those calories get redirected into storage. The scale can hold perfectly steady while the composition underneath rearranges itself.
Hormonal shifts. For men, testosterone declines about 1% a year after 30. That makes muscle harder to hold and pushes more fat toward the abdomen. For women, the estrogen drop across perimenopause and menopause does something similar, moving storage from hips and thighs toward the belly. Same mechanism, different timeline.
Slower cellular burn. Mitochondria get less efficient with age, and cells become less responsive to insulin. Both push the body toward storing fat rather than burning it, particularly around the organs.
The CDC's National Health and Nutrition Examination Survey documents these shifts at the population level. NHANES body measurement data tracks how average weight and waist circumference climb across age brackets — the trend is visible in the data long before it shows up in any one person's mirror.
The Number That Outranks Your Percentage
Here is the practical problem with body fat percentage: it tells you how much fat you carry, not where. And location turns out to matter more.
Increased risk for men: waist above 40 inches (102 cm)
Increased risk for women: waist above 35 inches (88 cm)
Those two numbers beat body fat percentage on three counts. A tape measure costs a few dollars. The measurement takes ten seconds. And it repeats reliably — unlike body fat testing, which can swing 3–5% depending on hydration, time of day, and which device you stood on.
Measure it the same way every time: bare skin, tape just above the hip bones, snug but not compressing, read at the end of a normal exhale. Sunday morning, before breakfast. Do not suck in, and do not hold your breath. Either one can shift the tape by an inch or two, which is often the gap between two risk categories.
A body fat calculator gives you the percentage to pair with it, and an Adult BMI Calculator gives you the screening number doctors still start with. None of the three is sufficient alone. Together they catch what any one of them misses.
What Actually Works at Each Stage
Start with resistance training. Two non-consecutive sessions a week — bodyweight squats, dumbbell rows, modified push-ups, carrying groceries — is enough to shift the trajectory. Eight to twelve reps, one to three sets. Beginners change fastest, and the effect does not expire with age. The American College of Sports Medicine puts resistance training at the center of its guidance for older adults — the 12th edition of its Guidelines for Exercise Testing and Prescription devotes a substantially revised resistance training chapter to exactly this point.
Then move your protein earlier. Most adults eat enough protein across the day but load it all at dinner. Moving 25–30 grams into the morning spreads the signal more evenly across the day.
A 58-year-old in Chicago made exactly these two changes. She weighed 152 lbs at 5'4" — BMI 26.1, technically overweight — and had jogged for years without ever picking up a dumbbell. Her body fat sat at 32% and her waist measured 36 inches. Six months of twice-weekly strength work plus eggs and Greek yogurt at breakfast moved her waist to 33 inches and her body fat to 28%. The scale dropped four pounds. The four pounds were not the point.
Add a daily walk on top. Around 7,000 steps a day is where the mortality data gets interesting for middle-aged adults, and ten minutes after a meal does something for blood sugar that an hour at the gym does not. Walking alone will not reverse age-related muscle loss, though. It improves insulin sensitivity and trims visceral fat, but only resistance work puts the tissue back. The two do different jobs, and the body-fat-by-age curve responds to both.
Ask anyone who has coached adults over 40 which variable decides outcomes and you get the same answer: not program design, but whether the person is still going in month six. Someone walking daily and lifting once a week beats someone who burned out of a six-day plan in week five.
Check with a healthcare provider before starting any new exercise or eating plan if you live with heart disease, joint problems, diabetes, or another ongoing condition.
Myths About Body Fat and Aging
| Common myth | What the evidence shows |
|---|---|
| "Gaining fat is just part of getting older." | Common, yes. Inevitable, no. Muscle loss is the main driver, and it responds to resistance training at any age — people in their 70s and 80s still build strength. |
| "Lower body fat is always healthier." | Below essential fat — 5% for men, 13% for women — hormone production, immune function, and bone health all suffer. Higher body fat with good muscle and a small waist often beats a very low number. |
| "Cardio is the way to lose belly fat." | Aerobic work burns calories, but resistance training is what protects lean mass and reduces visceral fat. Both together beat either alone for body composition. |
Frequently Asked Questions About Body Fat by Age
How much does body fat increase with age, and is that normal?
A climb of roughly 3–5 percentage points per decade after 30 is typical, and it is normal. It comes from muscle loss and hormonal shifts rather than any single habit. Holding your percentage steady across midlife means you are running ahead of the average. Large gains, especially around the abdomen, are not inevitable and respond to resistance training and adequate protein.
What is a healthy body fat percentage for a 50-year-old man?
Somewhere in the 18–24% band is the usual reference, and slightly above that is reasonable if your waist stays under 40 inches. Muscle mass and metabolic markers tell you more than the percentage alone.
Why does body fat move to the belly after menopause?
Falling estrogen changes where fat gets stored. Abdominal fat cells carry more receptors for lipoprotein lipase, an enzyme that becomes more active as estrogen drops, so storage shifts toward the visceral area even when your weight holds steady.
Can you build muscle — or reverse body fat gain — after 70?
You can build muscle, yes. Research from the National Institute on Aging shows people in their 70s and 80s still gain strength and size from progressive resistance training. Reversing the fat gain is harder. Progressive training plus adequate protein slows it and often partially turns it around, but full reversal is not a realistic goal for everyone. Past 70, watch the waist trend rather than chasing a body fat percentage. Protein at 1.2–1.6 grams per kilogram of body weight per day helps, ideally under professional guidance.
Should I track body fat percentage or waist circumference?
Track both, but lead with waist. It is more practical, more reproducible, and more directly tied to visceral fat risk. Use the percentage as context and watch the trend over months rather than the daily number.
Does BMI get less accurate as you age?
It does. BMI cannot separate muscle from fat, so an older adult can hold a "normal" BMI while carrying excess body fat and low muscle. Pairing BMI with waist circumference and a body fat estimate closes most of that gap.
Sources
NIH/NHLBI: Aim for a Healthy Weight — BMI and Waist Circumference
National Institute on Aging: Exercise and Physical Activity for Older Adults
Related Articles
Body Fat by Age for Men: What's Healthy, What Changes, and How to Measure Real Progress
Body Fat for a 40-Year-Old Woman: What's Normal, What's Not, and How to Take Control
How to Measure Body Fat Percentage: Which Method Is Actually Worth It?
BMI Calculator Blog. This content is provided for educational and informational purposes only. We encourage sharing with proper attribution to our site. Unauthorized commercial use is prohibited. Medical Disclaimer: The content of this article is for informational purposes only and does not replace professional medical advice, diagnosis, or treatment. Always seek the advice of a qualified physician or other qualified health provider with any questions regarding your body composition, weight status, or health goals.