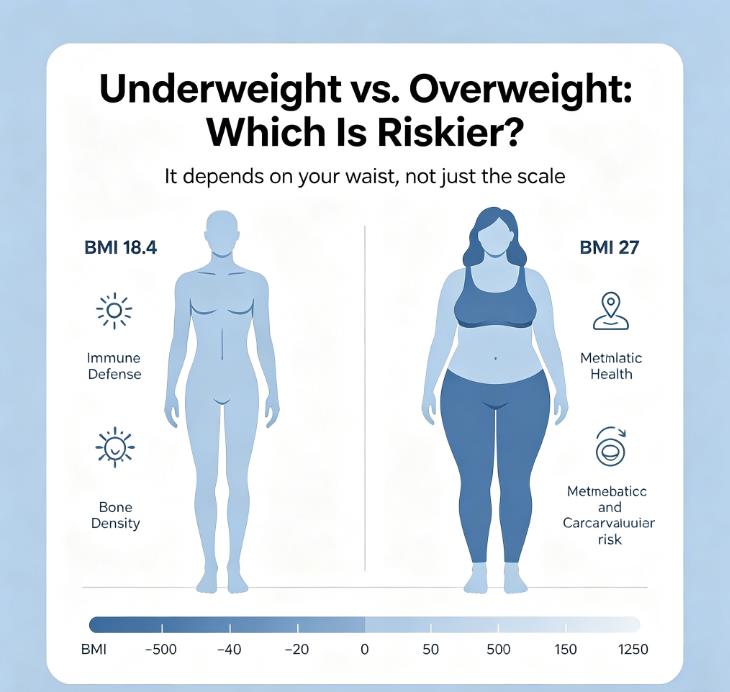
Overweight means a BMI of 25 to 29.9. Underweight means a BMI below 18.5. One affects roughly 1 in 3 U.S. adults, the other about 1 in 60. Both come with health risks — but they're not mirror images of each other. In pooled population data, underweight is consistently tied to higher all-cause mortality than mild overweight. This guide breaks down the real risks, and why the same BMI can mean two very different bodies.
What the Categories Actually Mean
The CDC and WHO use BMI to classify weight for adults 20 and older: underweight (below 18.5), healthy weight (18.5–24.9), overweight (25.0–29.9), and obesity (30.0 and above). These cutoffs were built for population health, not to judge your personal fitness. A BMI of 28 could belong to a 5'9" powerlifter or a sedentary office worker — the formula can't tell the difference.
See where you stand with our calculate BMI tool.
The Numbers: Overweight Is 20× More Common
About 32% of U.S. adults fall into the overweight category. Another 40% have obesity. That means roughly 7 in 10 adults are above the healthy weight range. By contrast, just 1.6% of U.S. adults — about 1 in 60 — have a BMI below 18.5. Overweight is roughly 20 times more common.
That imbalance shapes how public health messaging works. One side gets most of the attention. The other is often invisible.
How the Risks Compare
Both categories carry risks, but they don't look the same. Carrying extra weight, especially around your middle, increases chances of type 2 diabetes, heart disease and stroke, joint strain on knees and hips, and certain cancers. The WHO identifies overweight as a major driver of chronic disease.
But here's the thing most people miss: the mortality link is mostly in obesity, not mild overweight. A 2016 New England Journal of Medicine analysis of 239 studies found that overweight (BMI 25–29.9) was associated with lower all-cause mortality in pooled population data compared to normal weight, while underweight was tied to significantly higher death rates. A separate CDC analysis found overweight was not associated with excess mortality in pooled data. Underweight, on the other hand, was linked to about 34,000 excess deaths annually.
Being underweight comes with its own set of issues: weakened immune system with higher infection risk, bone loss and osteoporosis, nutrient deficiencies (iron, vitamin D), and hormonal changes including irregular cycles in women. One analysis found underweight individuals had a 1.4 to 2.5-fold increased risk for certain infections compared to normal-weight individuals.
What that means in practice: for early death, being underweight may actually be riskier than being overweight — especially if you're older. We regularly run into this nuance when answering reader questions about BMI risk comparisons, and it's almost never what people expect to hear.
From anonymized sessions of adults using our tools, about 1 in 5 people in the overweight BMI category have waistlines in the healthy range — often because they lift or play sports. The chart doesn't capture that.
Who Gets Mislabeled
Muscle weighs more than fat. A 5'9" CrossFit athlete at 190 lbs has a BMI of 28, same as a sedentary person with 30% body fat. BMI overestimates body fat for lifters. If you're active, a body fat calculator gives a more useful read than BMI alone.
Age shifts the picture too. As you get older, you lose muscle and bone. The standard 18.5–24.9 range was built for younger adults. For those over 65, research suggests a BMI in the 21–27 range may be linked to better survival in pooled population data. And ethnicity matters: the WHO sets lower cutoffs for Asian populations, where overweight starts at BMI 23. Our Asian BMI calculator uses these adjusted thresholds.
Putting This Information to Work
Look, I get it — the scale doesn't tell the whole story. But it's still a starting point. Start by calculating your BMI and noting the category.
Then measure your waist at your navel. Over 35 inches for women or 40 for men is a bigger red flag than BMI alone — and it takes thirty seconds. Adjust for your own context: active? over 65? Asian descent? The same number means different things. And keep the focus on habits, not hitting a specific BMI target.
Frequently Asked Questions
What's worse: being overweight or underweight?
It depends on your age and health status. Some research suggests underweight may carry a higher mortality risk than overweight. Both come with health risks, but they're different risks. Overweight is linked to diabetes and heart disease. Underweight is linked to weakened immunity and bone loss.
Can you be overweight and still be healthy?
Yes — but three things need to line up first. Check these before you assume the BMI number is benign:
Waist size. Women under 35 inches, men under 40 inches (lower for Asian populations).
Blood work. Normal fasting glucose, lipid panel, and blood pressure.
Activity level. Regular movement or training, not just a low body fat percentage.
If all three check out, BMI 25–29.9 alone isn't a reason to worry. If any are off, the risk climbs regardless of your BMI number.
Can you be underweight and still be healthy?
If you're naturally thin, eat well, and have no symptoms, it may be fine. But underweight is consistently linked to higher mortality risk in large studies, so it's worth paying attention to. If you're losing weight without trying, that's worth checking with a provider — it can signal an underlying issue.
Is BMI different for older adults?
Yes. Research suggests older adults (65+) with a BMI in the 21–27 range often have better survival outcomes than those at the lower end of the "healthy" range. The ideal BMI shifts with age.
Why is overweight so much more common?
About 32% of U.S. adults are overweight and another 40% have obesity — roughly 7 in 10 adults above the healthy range. Only 1.6% are underweight. Several factors drive the gap:
Food environment. Ultra-processed foods are cheap, convenient, and calorie-dense.
Sedentary lifestyles. Daily movement has dropped sharply over the past 50 years.
Socioeconomic factors. Access to fresh food, safe spaces for exercise, and healthcare vary widely by zip code.
Sources
CDC: Excess Deaths Associated With Underweight, Overweight, and Obesity
Global BMI Mortality Collaboration. BMI and all-cause mortality: individual-participant-data meta-analysis of 239 prospective studies in four continents. N Engl J Med. 2016;375(18):1749-1759. DOI
This article is for informational purposes only. It does not replace professional medical advice. Consider discussing your results with a qualified healthcare provider. The BMI Calculator Blog Team maintains editorial independence.
Related Articles
Overweight Definition: BMI 25-29.9, Health Risks, and When It Misleads
Gain Weight Without Gaining Fat: Science-Based Nutrition for Underweight Adults
Last updated: October 8, 2026.